
I’ve just released the latest edition of my B2B Marketing Automation Vendor Selection Tool (VEST), which contains detailed analysis of all 22 B2B marketing automation systems. Serious marketing of the new edition is yet to begin, but anyone considering purchase of a marketing automation system can buy the VEST now at the www.raabguide.com Web site.
The new report contains a rich trove of industry information. The one item that people usually find most interesting is the size of the industry. I put this at $325 million for 2011, a 50% increase from 2010. With 2012 half finished, I can now make a reasonably solid estimate for this year. I find the growth rate has actually accelerated to 60%, for a total of about $525 million.
I come at these figures in two ways.
The first is to look at installations by industry sector. Vendors in the VEST are asked for estimates of their client counts by company size. We distinguish four segments: micro-business with under $5 million revenue; small business with $5 to $50 million revenue, mid-size business with $50 to $500 million revenue, and large business with over $500 million revenue. Most vendors do provide the sector breakdown, although some are pretty rough estimates. For a couple of vendors, I’ve used my own estimate based on past data.
Using the sector counts plus estimated revenue per client for each sector, I can calculate the revenue by sector and for the industry as a whole. Since the client counts are mid-year figures, they should roughly equal the full-year average. I’ve only included figures for vendors who specialize in B2B systems; none of the other vendors (Neolane, Oracle, Silverpop, Aprimo, MarketingPilot) are provided estimates of the B2B portion of their client base. The table below shows my calculations:
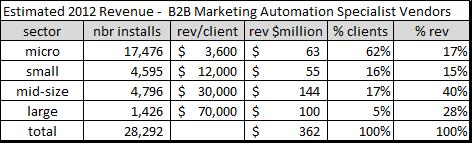
The total comes to $362 million estimated 2012 revenue. I estimate the non-B2B specialists and other marketing automation vendors (IBM, SAS, SAP, etc.) who are not listed in the VEST will have another $165 million in B2B revenue, for a total of $527 million.
The second method uses revenue estimates for individual vendors. It starts with the four largest B2B specialists: Infusionsoft, HubSpot, Marketo, and Eloqua. Each has announced revenue for 2011 (formally or in press interviews) and two, Infusionsoft and Marketo, have made forecasts for 2012. I estimated 2012 revenues for HubSpot and Eloqua based on their client counts and revenue per client. I then estimated revenue for the other specialist vendors by combining results from two methods: estimated revenue per employee and estimated revenue per client. Finally, I’ve added figures for the non-specialist vendors, using the same assumptions as before. The table below shows the results.
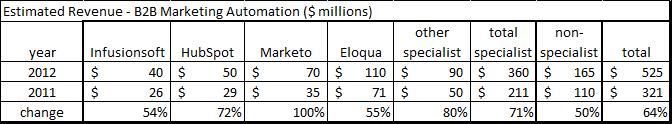
As you see – and I swear I didn’t cook these numbers – this gives $525 million, almost exactly matching the other method.
Of course, there’s more to these figures than just the industry size. One interesting point is that the “other specialist” vendors are actually growing faster than the big four vendors. This is a bit of a surprise, since we’d expect the industry to consolidate and squeeze out the smaller players. Still, remember that the big four control 75% of the revenue, a figure that has almost certainly increased in recent years.
The difference is client growth actually larger than the revenue estimates suggest. The table below shows that the client base of the “other specialists” grew by 80%, which is faster than any of the big four.
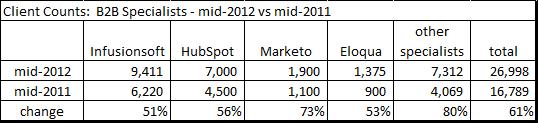
One caveat is that a number of the smaller vendors didn’t provide updated client counts, and they may be vendors who were not growing much. But the reality is that the next three largest vendors (Pardot, Act-On, and Net-Results) did provide data, and each grew by well over 100%. So the missing vendors don’t have enough volume to affect the big picture.
I’ll share one final set of data that also points to industry strength. The table below shows revenue per client for the big four vendors over the past two years. These are actuals except for the 2012 figures for HubSpot and Eloqua, and I consider those to be educated, conservative guesses.
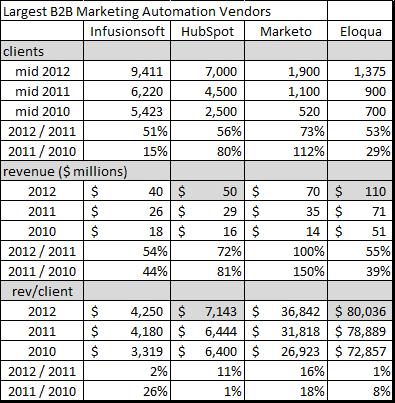
This table shows a consistent increase in revenue per customer across all vendors and all years. Given the intense competition within the industry, that’s pretty impressive: it shows that the big four vendors are managing to increase their revenue per client, which all must do to become profitable. I suspect the increase is less the result of firmer pricing than of broader product lines that let the vendors sell more to each customer. Nor does this mean that industry prices are falling: it’s possible – in fact, likely – that the smaller vendors are selling for less than their larger competitors, and that the average price in the industry is still dropping.
All told, this paints the picture of a healthy industry: still growing rapidly, still open to competition, and supporting sustainable prices. It’s a cheery bit of news.


