
“Demo or die!” – my PhD supervisor was very clear on what is the most critical path to success in academic research.
As I later learned, in the business world, ROI or Return on Investment calculations play a similar role.
You won’t be able to get executive buy-in, approval for budget, communicate success and ultimately progress in your career, unless you can estimate and then validate the ROI.
Why ROI is important in Customer Experience
Metrics such as NPS have become currency, accepted in blind faith by many, but CX professionals still have difficulty getting companies to take action on what can move these metrics.
1. Speed & precision of insights – having hard data rather than anecdotes is still something many CX professionals struggle with (and which is why we started Thematic!)
2. CX is perceived as fluffy, non-quantified and therefore not trusted.
3. People don’t truly understand the impact of even small increases in NPS on revenue
So how can you get people to take action on insights, demonstrate program impact and gain visibility?
Showing the linkage between NPS and financial metrics first, and then demonstrating ROI is the key here.
Why calculating ROI of CX is hard
ROI is easy to calculate for any investment that has immediate results.
For example, if I spend $1000 on Facebook ads, I can see within a week what kind of leads I can get from this investment.
Established businesses know the value of leads, because they know how well this convert to customers.
So, it’s easy to calculate the ROI:
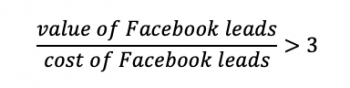
You need not just a positive ROI, but ideally greater than 2 or 3.
When it comes to seeing improvements in CX, it can take months or even years to obtain the results, and it’s a multi-step process:
Step 1. Measure CX using a metric like NPS and identify its drivers. (Some companies run a driver analysis. At Thematic, we can identify drivers by showing how themes in customer feedback can impact NPS.)
Step 2. Implement improvements
Step 3. Wait for customers to notice improvements
Step 4. Measure again and evaluate change in behavior. Are customers mentioning the same themes? What’s their impact on NPS?
Calculating ROI of CX investments can be hard because it’s not clear how long it would take to implement Step 2 and 3, and how effective might be the solution.
However, not investing into CX will result in significantly worse outcomes than not investing into advertising, such as Facebook ads.
Due to 3 reasons:
1. Customer expectations are continuously rising;
2. It is easier than ever to start a business and advertise to people world-wide;
3. Customer loyalty is difficult to both win and retain.
So how do you actually do it?
Step 1. Get the fundamentals right
First off, you will need the following basic research completed in order for the ROI calculations to be valid.
Choose your metric. In our case, it’s NPS.
The premise behind NPS is simple… It categorizes people into those who are more likely to recommend the company to others (Promoters) and those who are less likely to do so (Passives and Detractors).
People are more likely to recommend companies where they have great experiences and where they are treated well by the company and its employees. All examples of great CX!
This should translate into financial metrics that result in faster growth: lower churn, higher customer lifetime value and decreasing cost of customer acquisition.
Given the results from your last NPS survey, get the average annual spend per category (Figure 1)
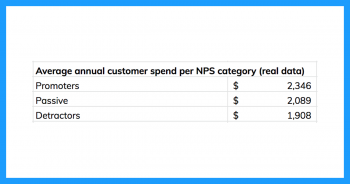
Your numbers should follow the same pattern…
~ Promoters spend more than Passives ~
~ Passives spend more than Detractors ~
If not, something isn’t right. The most likely reason is that the NPS isn’t measured correctly.
Here are the common measurement mistakes we’ve been seeing:
1. Offering people a financial incentive for filling out the survey can lead to people giving high scores instead of a truthful ones.
2. Making NPS into KPIs of individual people and even departments can lead to poor practices, such as “Give me a 10 or don’t respond”. (this is an especially common practice in some industries, such as car dealerships).
I hope you get to a state where the numbers make sense.
Step 2. Calculate the impact of an increase NPS on revenue (ROI of NPS)
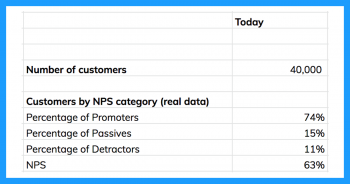
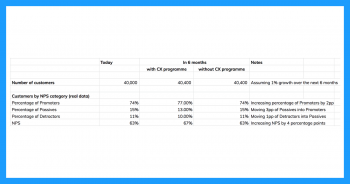
Now, you will need the total number of customers and a breakdown of the percentage of customers that fall into each NPS category (Figure 2).
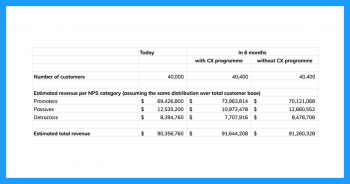
Now you can multiply the numbers from Figure 1 and Figure 2 to calculate the total revenue per NPS category.
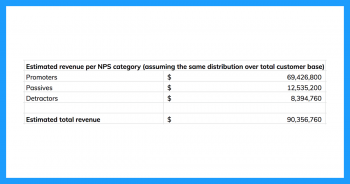
The sum is the estimated total revenue for the company and hopefully matches the actual total revenue.
Make sure to cross-reference here.
So, what would be an impact of an increase in NPS by a few points?
We need to make some assumptions here.
But here is a conservative example that shows some revenue growth in any case and models two scenarios:
A small increase in NPS distributed among all NPS categories and no increase in NPS (Figure 3).
These numbers alone are already quite insightful.
If we assume that the spend per customer stays the same, we arrive at the following numbers (Figure 4):
Step 3. Calculate the ROI
The increase in revenue with the CX program may not seem impressive, but it’s 42% higher than without it (Figure 5):
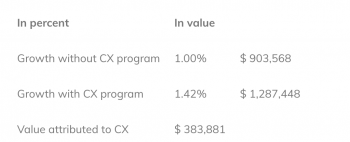
For this specific example, the value of NPS increase of 4 percentage points is around $384K.
A good ROI of 3x would be if this company spent $127K towards that increase.
The numbers will be especially meaningful if you can validate them against the metrics in the past.
Interested in getting the spreadsheets to help with your own calculations, and learn a second method for calculating the ROI of CX?
Then read the full guide to ROI of CX published on Thematic’s website.
As always, I welcome any feedback you might have! How can we make our guide even better?
Alyona Medelyan – PhD, NLP & Machine Learning


