
The only value a company will ever create for its shareholders and owners is the value that comes from its customers–current ones and new ones acquired in the future. To remain competitive, companies must determine how to keep customers longer, grow them into bigger customers, make them more profitable, serve them more efficiently, and target acquiring more profitable customers.
But there’s a problem with pursing these ideals. Customers increasingly view suppliers’ products and standard service lines as commodities. This means that suppliers must shift their actions toward differentiating their services, offers, discounts, and deals to different types of existing customers to retain and grow them. Further, they should concentrate their marketing and sales efforts on acquiring new customers who have traits comparable to those of their relatively more profitable customers.
As companies shift from a product-centric focus to a customer-centric focus, a myth that almost all current customers are profitable needs to be replaced with the truth. Some high-demanding customers may indeed be unprofitable! Unfortunately, many companies’ managerial accounting systems aren’t able to report customer profitability information to support analysis for how to rationalize which types of customers to retain, grow, or win back and which types of new customers to acquire. With this shift in attention from products to customers, managers are increasingly seeking granular nonproduct-associated costs to serve customer-related information as well as information about intangibles, such as customer loyalty and social media messaging about their company and its competitors. Today in many companies there’s a wide gap between the CFO’s function and the marketing and sales function. That gap needs to be closed!
Here’s the basic problem. With accounting’s traditional product gross profit margin reporting, managers can’t see the more important and relevant “bottom half” of the total income statement picture–all the profit margin layers that exist and should be reported from customer-related expenses such as distribution channel, selling, customer service, credit, and marketing expenses.
The marketing and sales functions already intuitively suspect that there are highly profitable and highly unprofitable customers, but management accountants have been slow to reform their measurement practices and systems to support marketing and sales by providing the evidence. To complicate matters, the compensation incentives for a sales force (e.g., commissions) typically are based exclusively on revenues. Companies need to not just increase market share and grow sales but to grow profitable sales. Compensation incentives should be a blend of both customer sales volume and profits.
Who are the troublesome customers, and how much do they drag down profit margins? Who are the valuable customers? What’s the difference between a valuable customer and a profitable one? More important, once these questions are answered, what corrective actions should managers and employees take to increase the profit from a customer? Measurements are the key.
Good vs. Bad Customers
Some customers purchase a mix of mainly low-profit-margin products. After adding the nonproduct-related costs to serve for those customers, apart from the costs of the mix of products and standard service lines they purchase, these customers may be unprofitable to a supplier. But customers who purchase a mix of relatively high-profit-margin products may demand so much in extra services that they also could potentially be unprofitable. How does a company measure customer profitability properly? In extreme cases, how does it deselect or “fire” a customer that shows no promise of ever being profitable?
Every supplier has what I call good and bad customers. Low-maintenance “good” customers place standard orders with no fuss, whereas high-maintenance “bad” customers always demand nonstandard offers and services, such as special delivery requirements. For example, the latter constantly returns goods or contacts the supplier’s help desk. In contrast, the former just purchases a company’s products or service lines and are rarely bothersome to the supplier. The extra expenses for high-maintenance customers add up. What can be done? After the level of profitability for all customers is measured, they all can be migrated toward higher profits using “profit margin management” techniques, which I’ll discuss later.
These observations have been around for decades. Back in 1922, William B. Castenholtz wrote in “The Application of Selling and Administrative Expense to Product” in the National Association of Cost Accountants (NACA) Yearbook:
“Very often, although a cost system may be nearly perfect and all possible factory economies may have been affected, a manufacturer may nevertheless show losses due to inadequate control over his selling and administrative expenses In fact, unless the same (costing) principles are applied in controlling selling and administrative costs (as for production), the entire advantage gained through efficient low-cost production may be lost.”
Pursuit of truth about profits
Why would a company want to know the answers to the questions about customer profitability levels? Possibly to answer more direct questions about its customers, such as:
- Do we push for volume or for margin with a specific customer?
- Are there ways to improve profitability by altering the way we package, sell, deliver, or generally service a customer?
- Does the customer’s sales volume justify the discounts, rebates, or promotion structure we provide to that customer?
- Can we influence our customers to alter their behavior to interact differently (and more profitably) with us?
- Can we shift work to or from some of our customers based on who, them or us, is more capable or has lower process expenses?
To be competitive, a company must know its sources of profit and understand its own expenses and cost structure. With the facts, what actions can be taken to increase profits? For outright unprofitable customers, a company can explore passive options of gradually raising prices or surcharging for extra work, hoping the customer will go elsewhere. For profitable customers, a company may want to reduce customer-related causes of extra work for its employees (e.g., unneeded extra product packaging), streamline its delivery process, or alter the customers’ behavior with pricing incentives so those customers place fewer workload demands on the company.
Activity-based costing (ABC) is the method that will economically and accurately trace the consumption of an organization’s resource expenses (e.g., salaries, supplies) to products and to the types and kinds of channels and customer segments that place varying degrees of workload demand on the company. It should no longer be acceptable not to have a rational system of assigning so-called nontraceable costs to their sources of origin. ABC is that system. Yet many companies still don’t use it.
ABC is a multilevel cost reassignment network
ABC uses multiple stages to trace and segment all the resource expenses as calculated costs through a network of cost assignments into thefinal cost objects: products, service lines, channels, and customers. It facilitates more accurate reporting because it honors costing’s causality principle (i.e., the relationship between cause and effect) for expense consumption relationships.
In complex, support-intensive organizations, there can be a substantial chain of indirect work activities that occur prior to the direct ones that eventually trace into the final cost objects. These chains result in activity-to-activity cost assignments, and they rely on intermediate activity cost drivers traced to consuming activities in the same way that final cost objects rely on activity cost drivers to reassign costs into final cost objects based on their diversity and variation.
Making indirect costs direct costs is no longer an insurmountable problem as it was in the past. Integrated ABC software allows intermediate direct costing to a local process or to an internal customer or required component that is causing the demand for work. It further allows tracing costs among the final cost objects. Resource and activity cost drivers reassign expenses into costs with a more local, granular work activity level than in traditional systems, such as the accountant’s rigid cost center step-down cost allocation method that reduces costing accuracy by relying on a single cost allocation factor for an entire support department.
ABC software is arterial in design, so it flows costs flexibly and proportionately. Eventually via this expense assignment and tracing network, ABC reassigns 100% of the resource expenses into the final accumulated costs of products, service lines, channels, customers, and business-sustaining work. Visibility of costs is provided everywhere throughout the cost assignment network, including for how costs are “driven” by the activity cost drivers that comply with the cause-and-effect relationships. This visibility aids in identifying where to focus improvement efforts.
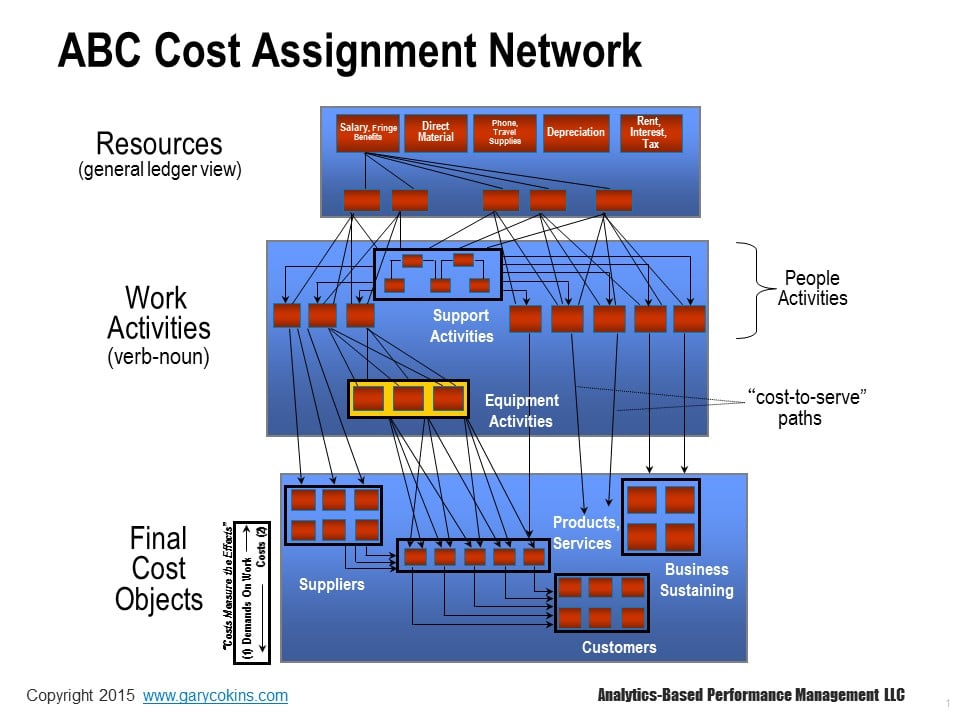
Examine the ABC cost assignment network in Figure 1 that consists of three modules connected by cost assignment paths. ABC provides a snapshot view of a time period’s costs (e.g., a month). Imagine the cost assignment paths as wide pipes and thin straws where the diameter of each path reflects the amount of cost flowing. The power of an ABC model is that the cost assignment paths and their destinations trace costs from beginning to end – from resource expenses to each type of customer (and optionally to each specific customer). Customers are the origin that results in the consumption of all of a supplier’s expenses and subsequent costs.
To understand why customers are the origin for costs, mentally reverse all the path arrowheads in Figure 1 from bottom to top. This polar-opposite switch reveals that all expenses originate with a demand-pull from customers–and the calculated costs simply measure the effect in the reverse direction.
Resources, at the top of the cost assignment network in Figure 1, provide the available capacity to perform work. Think of resource expenses as coming from the organization’s checkbook in the form of procurement purchases and employee payroll. Cash is exiting the treasury. Examples of resources are salaries, operating supplies, or electrical power. (Amortized cash outlays, such as for depreciation from a prior period, can also be modeled.) It’s during this step that “resource cost drivers” are identified and measured as the mechanism to convert resource expenses into activity costs. One basis for tracing or assigning resource expenses is the time (e.g., number of minutes) that people or equipment spend on performing work activities. A more popular basis is to use percentage splits of time from the resources totaling 100% among the work activities.
Work is performed by employees or assets, and resources are converted into some type of output in the work activities module. Activity cost drivers are the mechanism to accomplish this assignment. An example in a warehouse is the number of stocked items picked. In a bank, it’s the number of automobile loans processed. In a hospital, it’s the number of blood tests administered. A bonus from ABC is the unit-level cost consumption rates, which are useful for comparative benchmarking studies as well as for projecting future expenses and costs such as with rolling financial forecasts, what-if scenario analysis, and outsourcing decisions. (For the latter, “predictive accounting” entails a different aspect to managerial accounting involving the classification of resource capacity expenses as sunk, fixed, step-fixed, or variable relative to changes, and the classification depends on the time-length planning horizon and type of decision. These concepts are not discussed in this article, but they are important ones.
Final cost objects, at the bottom of the cost assignment network, represent the broad variety of outputs and services where costs eventually accumulate. Customers are the final-final cost objects. They create the need for resource expenses to be supplied. Final cost objects can be thought of as “the what or for whom” that work activities are performed. In advanced costing models, balance sheet items, such as inventories or customer receivables, can be traced using “cost of capital drivers,” such as a product’s average inventory level or a customer’s days’ sales outstanding [DSO].
Some activities in an organization don’t contribute directly to customer value, responsiveness, and quality. That doesn’t mean those activities can be eliminated or even reduced without doing harm to the business. For example, preparing required regulatory reports certainly doesn’t add to the value of any product or to the satisfaction of the customer. Yet that type of work activity is valuable to the organization because it enables the company to function in a proper legal manner. These types of activity costs are usually traced to a “sustaining cost object” group popularly called business sustaining costs. These business sustaining costs aren’t involved with making or delivering a product or servicing a customer, but the costs need to be covered with revenues for the total company bottom line profit.
The key to a good ABC system is the design and architecture of its cost assignment network. The “nodes” in the network are the sources and destinations through which all the expenses are reassigned via calculated costs. The network with its nodes delivers the utility and value of the data for decision making.
Beneath the iceberg: unrealized profits
With a valid cost model, Figure 2 displays a graph line referred to as the “profit cliff” (and sometimes the “humpback whale” curve). This line is the cumulative buildup of each customer’s profit. Customers are rank-ordered from the most profitable to the least profitable, including those who are unprofitable (i.e., customers with a financial loss where their costs exceed their revenues). The last data point reconciles exactly with the company’s total profit and loss (P&L) statement.
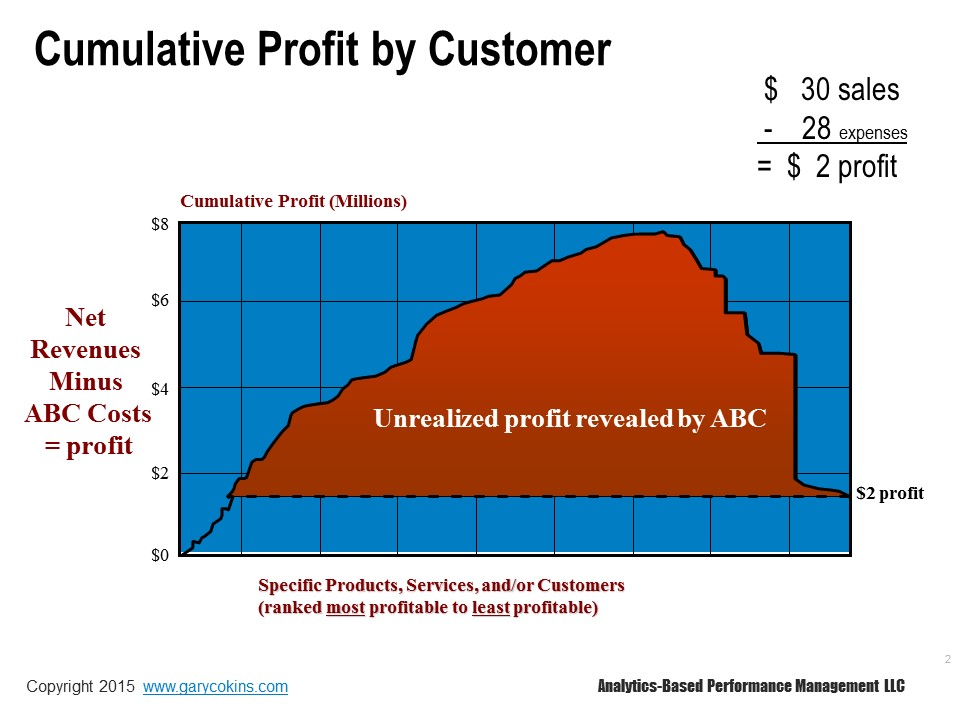
The graph illustrates how a substantial amount of unrealized profits can be hidden because of inadequate existing (and traditional) cost allocation methods and incomplete costing below the product gross profit margin line. Managers usually believe that the curve would be relatively flat. The broad averaging of traditional noncausal overhead cost allocations is crushing the cost accuracy and results in this flat-curve belief. ABC detects the unique variations of the final cost objects’ consumption of the work activities and their related capacity-providing resource expenses. ABC information usually shocks executives and managers the first time they see it because they have typically presumed that almost all but a few of their customers are profitable. Instead, they have large profit makers and profit takers.
By using ABC, there can now be a valid P&L statement for each customer as well as for logical segments or groupings of similar types of customers. The shape of this graph is typical for most companies. From left to right, the graph line reveals the company earns a substantial amount of profit from a minority of customers, roughly breaks even on some, and then loses profits on the remainder.
Future profit potential via customer lifetime value (CLV)
For business-to-consumer (B2C) companies, such as banking and telecommunications, customers pass through life cycles. This means there’s a difference between a currently profitable customer and a customer who may be more valuable in the future.
This difference shifts attention from the current run rate of past-period profit levels from their consumers to their future potential profit level. For B2C companies, accountants can calculate each customer’s CLV before and after various marketing campaigns and targeted offers and deals. This provides sales and marketing the ability to apply return on investment (ROI) measures to evaluate which customers can achieve the highest profit increase from actions.
Migrating customers to higher profitability
The crucial challenge is not to use ABC just to calculate valid customer profitability information from transactional data but to really use the information–and use it wisely. The benefit comes from identifying the profit-lift potential from customers and then realizing the potential with smart decisions and actions.
Figure 3 decomposes the ABC cost assignment network’s final cost object module in Figure 1 with more granularity. It displays two layers of a “nested” consumption sequence of costs in the bottom final cost objects module. The metaphor for this consumption sequence is the predator food chain where large mammals eat small mammals and small mammals eat plants. The final-final cost object–the customer–ultimately consumes all the other final cost object costs, except for the business sustaining costs.
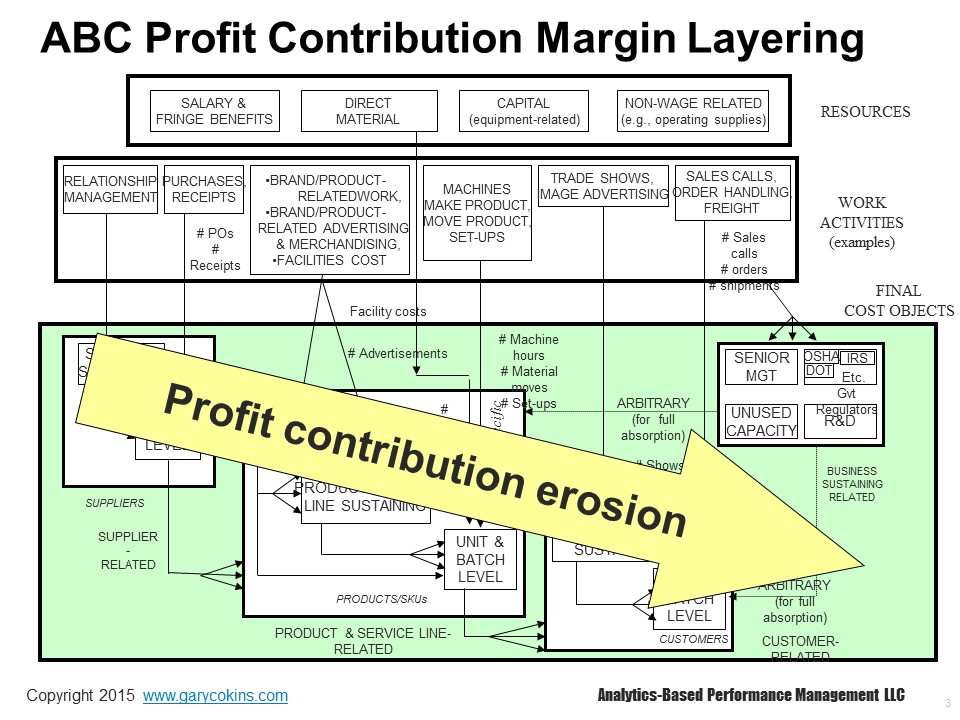
Within each of the major final cost object categories (e.g., supplier, product/service line, and customer), each has its own type of “sustaining costs,” which are also assignable to its end-product or end-customer using a cost object cost driver to reflect the diverse consumption relationship.
The left-to-right sequence of the activity cost drivers creates profit margin layers like layers in an onion’s skin. As a result, there can now be a valid P&L statement for each customer as well as logical segments or groupings of customers. Figure 4 is an example of an individual customer profitability statement.
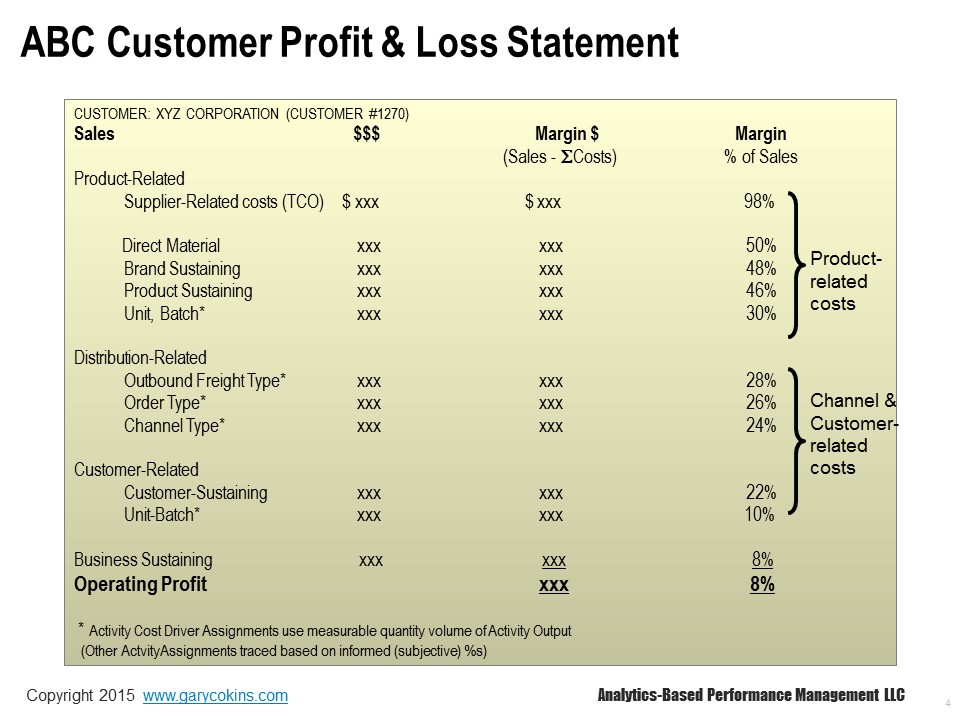
With an ABC P&L, managers can examine the individual products and service lines purchased in greater detail. They are a mix of high- and low-product-profit-margin purchases, based on their own unit costs and prices, as a composite average. Managers also can drill into details about the product-mix profit margins for more visibility. In addition, within each product or standard service line, the user can further examine the content and cost of the work activities and materials for each product and service line. This customer P&L information quantifies what many employees already may have suspected. All customers aren’t the same with their profit levels excluding sales volume.
Although customer satisfaction and loyalty are important, a longer-term goal is to increase corporate profitability for the shareholders derived from increasing profits from customers as if each customer were an investment in a stock portfolio. Think that the purpose of actions taken is to increase the financial “return on customer (ROC).” There should always be a balance between managing the level of customer service to earn customer loyalty and the spending impact that doing that will have on shareholder wealth.
In any company’s P&L there are two major “layers” of profit margin:
1. By the mix of products and service lines purchased.
2. By the “costs to serve” apart from the unique mix of products and service lines. (This is that “bottom half of the picture” I referred to earlier.)
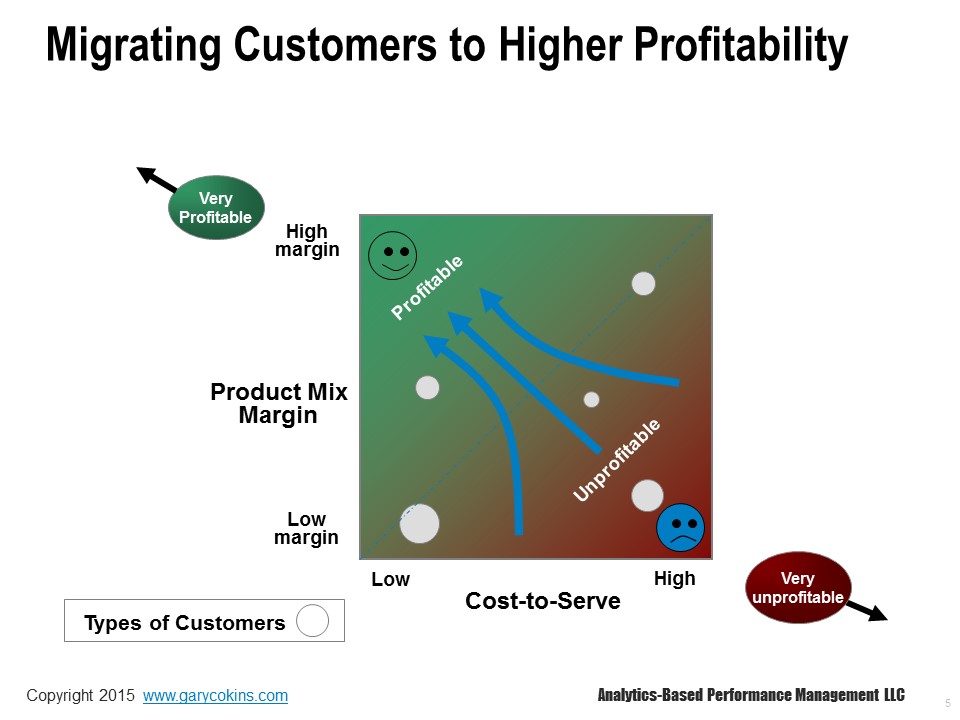
Figure 5 combines these two layers as a two-axis grid: (1) the “composite product profit margin” of what each customer purchases (reflecting net prices to the customer) and (2) their costs to serve. Individual customers (or grouped cluster of customers with similar traits) are located at an intersection where the circle diameters reflect each customer’s revenues. Figure 5 debunks the myth that customers with the highest sales volume are also generating the highest profits. The objective is to generate more profits from all customers regardless of their intersection location. This is represented by driving customers to the upper-left corner of the grid. Examples of actions that will do this are surcharge pricing, up-selling, and cross-selling.
When analytics software is applied, finance and marketing teams together can determine “next-best-offer recommendations” based on a market basket analysis of product or service transactions. The analysis uses “association rules,” which identifies items that frequently follow other items in transaction-based data. For example, if customers have purchased items A and B, they often also purchase item C. With that insight, companies can recommend offers to customers who have only purchased items A and B.
Note that migrating customers to the grid’s upper-left corner is equivalent to moving individual data points in the “profit cliff” profile in Figure 2 from right to left. Knowing where customers are located on the matrix requires ABC data.
A critical reason for knowing where each customer is located on the profit matrix is to protect the most profitable customers from competitors. Because so few customers typically account for a significant portion of the profits, the risk exposure from losing them is substantial. In Figure 2 the farther to the left side of the “profit cliff” profile distribution curve that the curve’s peak is located, the more sensitive the bottom line corporate profit is to competitor attacks from winning a company’s key customers.
Options to raise the profit cliff curve
What does a company do with the customer profit information? In other words, what actions can an organization take to increase profits from its customers?
Although this is only a partial list, a company can increase profitability by doing the following:
- Manage each customer’s “costs to serve” to a lower level;
- Establish a surcharge for or reprice expensive “costs-to-serve” activities;
- Reduce services minimally valued by customers;
- Introduce new products and standard service lines;
- Raise prices (which may not be feasible in competitive markets);
- Abandon unprofitable products, services, or customers.
- Improve business processes with higher productivity;
- Offer the customer profit-positive service-level options;
- Increase costs on activities for which a customer shows a preference;
- Up-sell and cross-sell the customer’s purchase mix toward richer, higher-margin products and service lines; or
- Discount to gain more volume with low “cost-to-serve” customers.
It’s important for anyone interpreting the profit-distribution diagram to understand the following key issues about it before acting hastily, which can result in bad decisions:
- This snapshot view of a time period’s cost doesn’t reflect the life-cycle costs of the products, service lines, or customers that have consumed the resource and activity costs for that particular time span. For example, a new product may be in its shake-out period with imminent cost reductions to it and low sales volume that will grow. In the next time period’s snapshot, the product will move to the left of the “profit cliff.”
- In some cases, some products deliberately are sold as a loss to generate higher sales of the more profitable products.
The time for the CFO finance and accounting function is now
Much has been written about the increasing role of CFOs as strategic advisors and their shift from bean counter to bean grower. Now is the time for the CFO’s accounting and finance function to expand beyond financial accounting, reporting, governance responsibilities, and cost control. They can support sales and marketing by helping them to target the more attractive customers to retain, grow, and win back and to acquire the relatively more profitable and valuable ones.
Copyright 2015 by IMA®, Montvale, N.J., www.imanet.org, used with permission.


Very comprehensive assessment of the state of customer profitability and CLV from a financial perspective. A lot of useful options. I’d submit that another effective method of reducing onboarding expenses, continued proof necessitity and cost-to-serve, while increasing profitability, is to target, and acquire, better-fitting and more potentially profitable customers at the outset: http://customerthink.com/avoiding-the-one-night-stand-targeting-customers-who-will-stay-with-you/
One of the great financial quotes related to customer loyalty behavior that I’ve seen can be paraphrased as follows: Increasing customer retention by 2% has the same bottom-line effect as reducing internal costs by 10%. Should be sufficient incentive for CEOs, CXOs, CCOs, and CFOs.
Wonderfully done.
For me, it is important that the company add to its balance sheet customer data:
1. Customer Value Added,,,,how are we doing versus competition? What are trends
2. Customer Assets, which can be broken down as you advise
This is a fantastic piece of work that every CxO and GM should read. It is all about really knowing the customer and what it takes (people and $) to serve that customers. I agree that customers should be segmented based on profitability and hassle factor but I am uncomfortable with a black and white view of the situation.
The core assumption in your work, if I understand it correctly, is that the organization is optimized and well functioning. Most organizations are not and CLV-in action is messy. With profit as the core reason for being, it skews organizations to make decisions that actually hurt profit.
Let’s take the customer support function. By focusing only on profit, the call center function is measured on ‘one and done’. Get off the phone and close the case. The result is – the customer is dissatisfied, needs more help, complains on Twitter, etc. which in turn drives up the cost of supporting them. Is this a customer that should be dropped – may not. Had the customer support person been measured differently – say on customer success and satisfaction – the call might have taken longer but the customer would have been happy with the resolution and might have shared their brand happiness with other prospective customers.
Another example is the current trend of B2B customer success departments which are thinly veiled upsell/cross sell teams. The customer is expecting someone who is measured and vested in see them be successful. Instead they experience a lot of hand holding during onboarding and little after that other than the periodic call to ‘check in’ and see if the customer will buy more. The result is at time of renewal, the purchase decision t’s NOT a no brainer.
Profit is king but it needs to be viewed and managed holistically over the lifecycle of the relationship, not at the activity or discrete time block level.
Echoing the previous comments, this is a useful & thorough reminder as the importance of implementing ABC to empower bottom-up calculation of customer profitability.
I would simply add that such a comprehensive view of fixed & variable costs (correctly attributed to channels, products & customers) also allows aggregation to achieve other under used measurements. I’m thinking of the implementation of Return On Marketing Expenditure (ROME). Calculating this for all your marketing activity to enable transparent conversations between CMOs and CFOs on marketing budget allocation is another key cultural step forward in the cooperation needed.
I agree that in many companies, there’s a wide gap between the CFO’s goals and objectives and those of sales and marketing. Every day, business developers and salespeople take on risks that have direct impact on the company’s financial performance, yet, CFO’s have little insight into what happens in demand generation. Leads are scored and qualified, resources are committed, pipeline values are calculated, then filled with opportunities, forecasts are made. All of this must be offset against the company’s ability – or capacity – to absorb the risk. In a kinder, more perfect business world, CFO’s, CMO’s, and CSO’s play together in the same sandbox, building solid revenue structures that don’t crumble, collapse, and fall. That doesn’t happen often. “Earnings failed to meet analyst expectations . . . ” We’ve all heard it.
In manufacturing, where I have worked much of my career, Activity Based Costing has been extraordinarily helpful for identifying opportunities for increased operating control, or cost reduction. But this benefit contributes to its limitation for decision making on projects that have future strategic importance. When considering those opportunities, looking through the lens of ABC might cause them to appear to have low, or no, remunerative value. So in that sense, I think it’s a misapplication to use ABC for deciding whether to enter a market or to cultivate an account that has high potential for future value. And knowing if a prospect will have a proclivity for being ‘demanding’ and therefore, unprofitable, would require a clairvoyance that many times, we don’t have. Even still, ‘demanding’ is not always negative. I’ve seen demanding customers greatly improve a company’s ability to support other clients.
ABC is also challenging to implement. Should costs be distributed by unit volume? By contribution to revenue? Profit? Or something else. How would large expense items, such as CXO salaries be parsed? And you’ve already pointed out that not every expense category should be included, such as regulatory compliance, safety, IT security, etc. In any event, the decisions around all of these items can create vastly different numerical and decision outcomes.
You mentioned that every vendor has ‘good’ and ‘bad’ customers. This can be true. It would be nice if we could all wave the magic wand and have only ‘good’ customers. But for now, I’m afraid, we’re stuck with both. The problem is, most customers are mixed. They’re ‘gad’ customers – I don’t know a better term to use. Everything is going swimmingly for a few quarters, and then they experience a supply chain interruption, or a product-line makeover. Suddenly, there are stock outages, parts that don’t fit. Materials are returned for re-work. Rush orders are shipped. Product engineers fly to remote factories to snuff out major problems. What was a profitable customer quarter-to-quarter has just gone into the tank. ABC tells you to fire them, because right now, they’re not showing much hope of being profitable. But there’s a problem. You need this customer, because without their consumption, your raw material costs will go up 38%.
Which brings me to my last point. I believe salespeople should be compensated on revenue, not profit. There is too much outside of a salesperson’s control to allow that dependency. Many companies allow for this by paying different commission rates for different products. In the case of IT, generally, highest rates for services and support fees, and lower rates for lower-margin products like hardware. “We have to staff this project with offshore programmers. Our margins are much higher when we use them, and my commission check depends on it.” “Sorry, but the only people we can put on this are based in the Dallas office.” “Oh. Would our staff in Bangalore be available if we waited 30 days – I could hold off the purchase order till then . . . ”
Most companies would be loathe to have this type of game playing going on. But for salespeople with a commission check riding on profits, it’s not a game – it’s money.
Of course, Andy is right.
This is because companies have a normal business strategy which every one signs off on.
No customer strategy exists (which all departments are part of). We first build a customer strategy (with people from all departments including the CFO). This outlines 1. the role of the CFO and others. 2.Departmental customer tasks and goals 3. Leadership of CXO’s such as CFO’s in various strategies and tasks. 4. Key performance goals for CXO’s etc.
The Customer Strategy is used to build the Business strategy. The Customer Strategy has an agreed upon purpose for the company (and this is not profits) and it forces customer alignment and breaking of silos.
This is outlined in my book Total Customer Value Management: Transforming Business Thinking ( http://www.sagepub.in/books/Book235942 )
Companies and consultants cannot change things without following the right steps. Otherwise the CFO will remain responsible for profits!
Andrew,
Wow ! I am very impressed that you comprehensively read my ABC-related article. I agree with most of your observations.
As a preface, allow me to position what I believe should be the primary purpose of ABC information (and management accounting information in general). It should NOT be to directly provide answers and result in some of the knee jerk types of decisions that you described. But rather the information should generate questions and stimulate discussion that would include many of the non-financial factors that you provided examples of.
Regarding the “how to” for deciding techniques to allocate costs (better termed as tracing and assigning based on cause-and-effect relationships), that involves understanding how to “model” them. (To make a long story short, there is an ABC rapid prototyping approach with a few iterative models that expand on the preceding one that “right-sizes” the model within a few weeks, not months. I can share more about this.)
Where I disagree with you is to regarding your position that the sales force incentives should be exclusively 100% on sales volume. When the incentive is a blend (e.g., 60% sales with 40% customer profit), experience reveals that the sales force quickly learns about the factors influencing customers’ excessive costs that erode profits. They then pro-actively try to alter a customer’s behavior in harmony with the supplier’s expense structure possibly applying “menu-based service level options” (e.g., FedEx 1 day, 2 day delivery). For example, price discount to order less frequently with larger order quantities. Yes, in that example, robust cost information would be needed to calculate the maximum price discount before the ordering becomes profit negative.
I very much liked your comment. To clarify, my message is there is a wide gap between the CFO and the marketing and sales function. The CFOs need to get more involved to provide insightful information to determine the more attractive customers to retain, grow, win-back and acquire as well as how much to optimally spend doing each of those for each customer micro-segment (and even for individual customers).
Gary Cokins (author of the article)
To Michael Lowenstein … Thank you for your comment. I am in agreement with you. I just now read your “one night stand” piece you wrote in the CustomerThink link you provided and very much like it.
To clarify, my primary message with my article is that there is a wide gap between the CFO and the marketing and sales functions. The CFOs need to get more involved to provide insightful information to help sales and marketing determine the more attractive customers to retain, grow, win-back and acquire as well as how much to optimally spend doing each of those for each customer micro-segment (and even for individual customers). It is an optimization problem because a supplier can over-spend with loyal customers and arguably destroy shareholder wealth, but in contrast under-spend on marginally loyal customers and risk their defection to competitors. It is an ROI on customers challenge.
Gary Cokins (author of the article)
To Christine Carroll … Thank you for your comment. Very insightful. You may wish to read my observations to the others who commented.
To clarify, and repeat what I wrote to Andrew Rudin, the primary purpose of ABC information (and management accounting information in general) should NOT be to directly provide answers and result in some of the knee jerk types of decisions. But rather the information should generate questions and stimulate discussion and conversations that would include many of the non-financial factors that you provided examples of.
Gary Cokins (author of the article)
I would love to see some examples of more holistic compensation schemes that keep reps and others connected to the big goals of the company.
Most CEOs are looking for profitable growth. Sometimes just growth. Occasionally survival (cash flow). In the ideal world these goals should percolate down through the organization.
And they do, in a silo’d fashion, leading to dysfunction. Marketing is measured on new customer acquisition, so that’s what they do, bringing in customers that will never buy and/or won’t be profitable. But the numbers look good, so why not?
Sales is ordered to close deals and drive revenue, so they do. Without any counterbalances on costs or customer satisfaction, that too can lead to unintended results: unprofitable growth.
Customer service is measured on cost, so they off shore, automate, terminate calls and otherwise do whatever they can to avoid spending money on customers. But, oops, that means some “good” customers will leave, and cost the company money as marketing and sales have to find replacements.
So it seems to me that everyone should have a stake in the company’s success, even if they have only a tangential contribution. If for no other reason than to remind everyone that “we’re all in the same boat.”
ABC could be one input to a balanced scorecard approach to compensation and measurement, but probably not on a deal-by-deal basis. Customer satisfaction could be another.
I’ve been on a variety of compensation plans in my 15 years in sales-related jobs, from mostly salary with small bonuses to 100% commission. One management plan had a profit component related to controllable expenses. In another, I was paid based on gross profit. Did I quickly learn which products were most (gross) profitable? You bet! Did I care that some products that paid high commissions also carried a burden of high support costs? Not so much.
My main concern about ABC, which I find an intellectually appealing approach to understanding costs, is implementation. My feeling is that most companies won’t want to do the work, and the true costs are spread around the organization so no one group has to take ownership. Except, of course, the CEO and CFO.
Hi Gary: first, thanks for writing an article that really helped me stretch my mind, and challenged my thinking.
We will have to agree to disagree on the commission question you referenced above. In situations where a sales rep has full control over product cost, paying commission on profit seems a sensible practice. But in my experience, when it comes to profitability, salespeople control a mere shred of what goes into Cost of Goods Sold and support costs. Instituting a policy that ties as much as 40% of ‘at risk’ comp to profits would result in so much administrative hair splitting that nobody would have time to sell, let alone build a product. There are infinite examples, but I’ll illustrate with two so that this has more clarity:
1. Stefan works for a chemical company and sold a large order to a customer, and the customer gave Stefan’s company the standard two-week lead time. When the order was put into production, the operations manager did not have any liquid compound (the normal main ingredient) in stock, and instead had to use a dry compound to meet the delivery date, which required four times the expected amount of time in the milling operation. The increased complexity meant that this batch took longer to pass quality control, as well. Using ABC costing, this order was produced, packaged, and shipped at a significant loss to Stefan’s company.
Should Stefan’s commission be docked? In this scenario, most people would not expect him to take a hit. He should be paid on revenue.
But what if the CFO argued that Stefan did not negotiate hard enough to push the delivery date back so that the preferred material could be used, and that Stefan shared responsibility for the financial loss. I will save for later how such negotiation might erode customer experience, and the added burden this commission model places on everyone in an organization. But Stefan would be in between a rock and a hard place. He must either get the customer to accept a late delivery (which risks upending THEIR production), or he winds up with little or no compensation whatsoever for his effort. Assuming that Stefan really went to the mat to preserve his company’s profit margin, how long would Stefan’s customer remain a customer? What would be their reaction if the same thing happened two weeks later? Such hiccups occur every day and in manufacturing (and elsewhere), and it would be unimaginable that companies could develop enough rules, policies, and exceptions to deal with the concomitant issues.
2. Tania sold a huge hardware order, including printers, to a large, multi-site healthcare institution. Tania’s customer elected not to buy the extended service plan until after the warranty expired (90 days). But just one week after they went live, a known manufacturing defect caused many printers to fail in the field, and Tania’s customer was livid. They expected the machines to be serviced on site (normally, an add-on cost), because the standard warranty coverage required the machines to be shipped to a depot repair center. They felt they should not have to do that. Tania did what she felt was right by the customer, and insisted that her company service these printers in the field, a concession that was provided over 30 days until the hardware problem could be corrected, and replacements could be shipped to her client.
Clearly, Tania’s company took a beating on service. But what if paid-on-profit Tania had stonewalled the customer’s insistence on field-level support? How would the customer respond? And what legal issues would have ensued? What bad-customer-experience dirt would Tania’s competitors have been able to exploit, and how badly could that damage Tania’s company? Having been on the other side of that equation, I can assure any reader that there’s no product feature or marketing content that can ever approach the firepower you get from a competitor’s ravingly unhappy client.
I agree that an account manager’s role is to . . . manage the account. And that means setting proper expectations and making sure both parties engage in a way that’s mutually profitable. But when profits and commission payments are co-mingled, it opens an extraordinarily difficult set of customer experience issues, and brings vendors to a place that most would choose not to venture.
Andrew, Bob, and Gautam (and Christine and Michael too),
First, I am pleasantly surprised by the stimulating exchange of comments and reactions to my article. Thanks to all.
Andrew’s examples are making me re-think my suggestion for a “blended” incentive mix of sales and profits. He raises circumstantial points. Bob chimed in that only the “controllable costs” should be included yet still use the “blended” approach. I will add that accountants have methods of calculating costs “at standard” (i.e., under normal operating conditions) and isolate “cost variances” from the expected ones. These variances could be excluded from the incentive compensation calculations.
Ultimately isn’t the issue here about accountability? My position is there are imbalances among four groups (excluding the customers):
#1 The salesforce (growing sales and increasing customer satisfaction for retention
#2 The “silo” functions (who somehow should be integrated)
#3 The CFO (who seeks to represent the shareholders / owners … #4)
#4 The shareholders / owners (who simply want to earn more wealth however the first three accomplish that)
The debate here seems to be how #3 and #4 should influence #1 to reward the #4 rather than maximizing #1’s self-serving bonuses.
The option to NOT bother to calculate and report a P&L statement for each customer denies the opportunity to generate questions and stimulate conversations about what actions might improve profits. It would also prevent the visibility, currently hidden, for valuable “learning” about what “drives costs” (which can explain why some “bad” customers are unprofitable).
I am not a sales force or incentive compensation expert. My position is it is better to provide customer level P&L information than to NOT have it. With the information all of the parties can draw insights not previously available.
Indirectly related to Bob’s point, an ABC system can be much more quickly implemented than most organizations realize, including CFOs. In my consulting I apply the “ABC rapid prototyping” method that starts with a 2 day Model #0 build typically with only 5 managers quickly defining activity cost relationships and estimating driver quantities. Within a few weeks and a few “iterations”, the result is a permanent repeatable ABC production system with “good enough” accuracy.
I conclude that I believe the status quo to not report customer level P&Ls poses risks. And the obstacle is more with the type of CFOs that are “bean counters” focusing on external financial accounting (for regulatory compliance) rather the being “bean growers” to provide managerial accounting information for decision support.
Gary … Gary Cokins (the author of the article)
Completely agree that CFO’s need to lead the accounting and financial control teams beyond the confines of the silos to more actively support the acquisition and leveraging of attractive customers. That said, your “bean counter” observation is absolutely accurate in the vast majority of companies. They can move from tangential and marginal to direct contribution; but, either by virtue of corporate culture or architecture, they typically don’t.
Some years ago, I gave a keynote presentation at major international CFO conference in Europe; and my topic was how these senior executives could directly and indirectly contribute to driving customer value and loyalty behavior. The case and evidence for this was strong and compelling, but my equally strong impression was that they were too myopic to be bothered. It occurred to me that, to have CFO’s be more effective here, CEO’s and COO’s need to be leading and sustaining this effort – and not by telling the CFO’s that their job description includes helping the company get higher NPS scores (which have very little impact on driving value or sales).
Gary and Michael, I agree. We have found the kind of P&L for each customer to be very important, interesting and illuminating, and it allows to understand the value we are adding and could add, and how to ‘sell” our price based on the benefits
I like the ideas expressed here by all. One factor that is really important to keep in mind is that not everything that’s valuable about a given customer can be tracked through ABC or financial systems. For example, some customers have strategic value beyond the current revenue and cost associated with them. Strategic value can be derived from their influence to other customers, insights the company gains from them that helps the company be more agile or innovative or smooth-running, and so on.
Lynn (and other commenters) … All very valid comments. As the author of this “customer profitability” article I repeat my earlier comment: The primary purpose of ABC information (and management accounting information in general) should NOT be to directly provide answers and result in some of the knee jerk types of decisions. But rather the information should generate questions and stimulate discussion and conversations that would include many of the non-financial factors that examples have been provided in the prior comments. Think of this type of reporting as a focusing method.
Gary Cokins (author of the article)
Most companies have structural and historical issues re. customers. That is, only those functions whose job descriptions include regularly touching customers have even a remote “feel” for what drives behavior and represents value. Paraphrasing total quality guru W. Edwards Deming, who said that every person in the company has one of two functions – providing value to the customer or serving someone who provides customer value – CFOs would be more contributory, and more sensitive to what creates and sustains profitability, if they could more regularly touch the customer and participate in reviews of data that indicate how the elements of value that drive behavior are performed.
Gary, we talk about teaching sales people to sell value. Your methodology does two things:
1. It will force companies to understand customers and their profitability
2. Determine what will create value in the current situation
3. How to sell this value
Too few companies do the first well
I enjoyed this article and discussion Gary. As an advocate and practitioner of Customer Profitability management and measurement for over 20 years, it is always pleasing to see renewed interest in this essential form of analysis.
The biggest challenges I have seen in industries which are proponents of CPA is actually having the courage to manage to the facts. Vested interests in Marketing, Sales and Channels often have latent fear of “discovering” that their programs have poor performance… and yes it is Finance’s role to play “bad cop” when that is true. PS I am a Chartered Professional Accountant as well as an analytics practitioner of 30 years so have worn both sets of shoes. It takes a while to get trust into the metrics, and to get smart about bases of comparison such as peer groups but when clients do they benefit in a big way.
9/10 of the time poor customer profitability is the consequence of poor delivery or pricing. There are no ‘bad” customers other than those who don’t pay. Unprofitable customers are usually overserved or underpriced.
The LTV vision warrants comment as well. This emerged as a “must have” at the behest of Marketers, who sought to make their performance look better by taking into account future business streams often extending well beyond the horizon of plausible prediction. Certainly NPV looks better than current year profitability almost always… but practitioners would be well advised to consider the risk of assumptions in LTV models and exactlyt how much current cash they are willing to “bet” on the assumptions in LTV models.
Thanks for this nice piece !
You can reach me at http://www.objectivebusiness.com or buy my book at Amazon if anyone wishes to learn more. http://www.amazon.com/Customer-Profitability-Analytics-practical-technologies-ebook/dp/B00XFWGJ1Y
Dave McNab, CPA, CA
Objective Business Services Inc.
Good point about watching out for those assumptions in LTV models, Dave. I too am skeptical of marketers or customer experience practitioners too soon wanting to measure impact in LTV or even 5 year NPV.
The top priority is to understand incrementally first and what this means in pure profit terms now (including all impacted fixed & variable costs not just “marketing costs”). On that gospel, Prof Bob Shaw is right to argue for ROME instead of just ROI or ROMI.