
Based on a study of 620+ data professionals, we found that data science skills fall into three broad areas: domain expertise (in our case, business), technology/programming and math/statistics. I discuss the implications of study findings for current data scientists, would-be data scientists and the recruiters who try to find them.
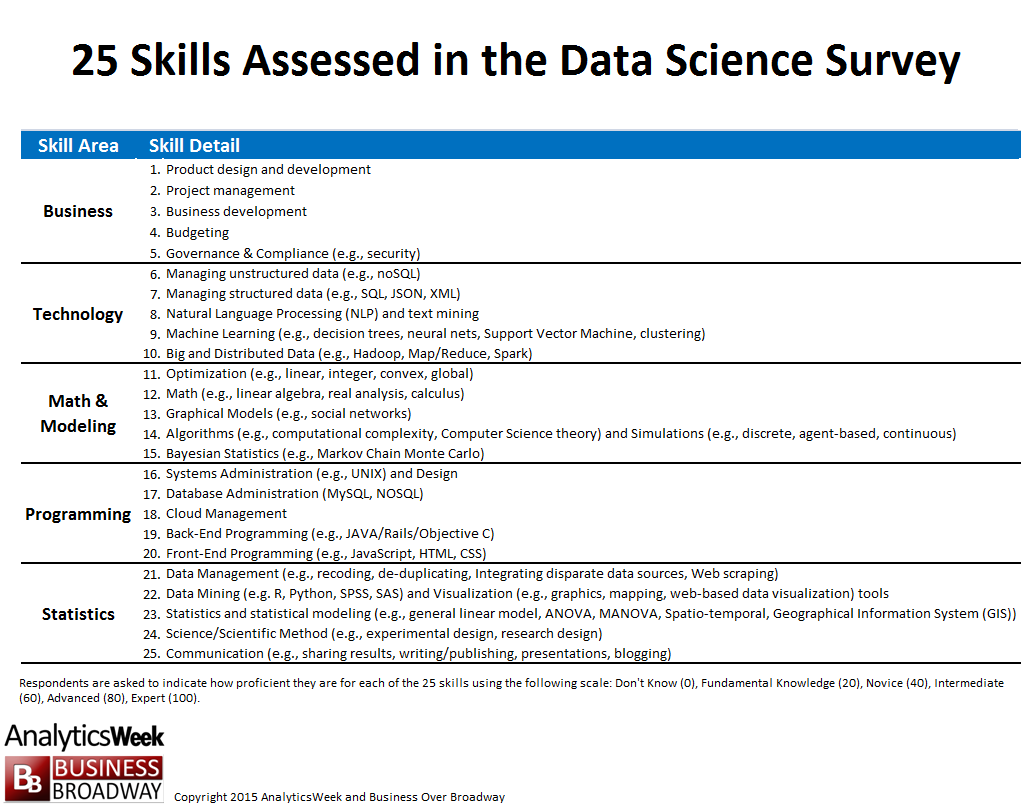
Figure 1. 25 Data Science Skills Assessed in the Data Science Survey. Click image to enlarge.
Data science is our ability to extract insight from data. The common belief is that there are three major skill areas that support the practice of data science. They are: domain expertise (in business, this is business acumen), technology/programming skills and statistics skills.
In our ongoing study about data science, we measured proficiency in 25 distinct data science skills among data professionals (see Figure 1). We grouped these 25 skills into five different areas: business, technology, programming, math & modeling and statistics.
Dimension Reduction through Factor Analysis
While we might think that proficiency in the 25 data skills fall into these five areas, we can also see what the data tell us. Toward that end, I employed the use of factor analysis. A factor analysis is a data reduction technique that is commonly used when you have a large number of variables in your data set and would like to reduce the number of variables to a more manageable size. In general, factor analysis examines the statistical relationships (e.g., correlations) among a large set of variables and tries to explain these correlations using a smaller number of variables (factors). Those underlying factors (variables) are then used to explain the phenomenon you are studying.
The results of the factor analysis are presented in tabular format called the factor pattern matrix. The factor matrix is an NxM table (N = number of original variables and M = number of underlying factors). The elements of a factor pattern matrix represent the regression coefficients (like a correlation coefficient) between each of the variables and the factors. These elements (or factor loadings) represent the strength of relationship between the variables and each of the underlying factors. The results of the factor analysis tells us two things:
- number of underlying factors that describe the initial set of variables
- which variables are best represented by each factor
Results
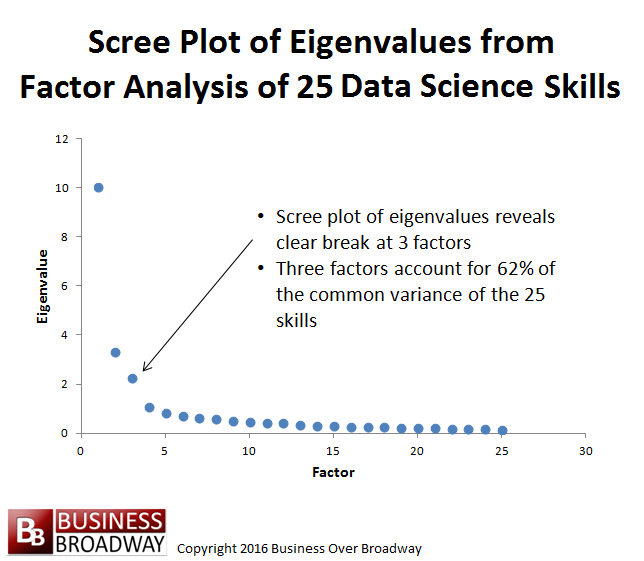
Figure 2. Scree Plot of Eigenvalues from Factor Analysis of Proficiency Ratings of 25 Data Science Skills.
This use of factor analysis is exploratory in nature. That is, I didn’t impose a pre-defined structure on the data itself. The pattern of relationships among the 25 skills drove the pattern of results. While human judgment comes into play in the determination of the number of factors that best describe the data, the selection of the number of factors is based on the results. The goal of the current factor analysis was to explain the relationship among the 25 skills with as few factors as was necessary. Toward that end, there are a couple of rules of thumb that I used to determine the number of factors using the eigenvalues (output of factor analysis). Eigenvalues represent the percent of common variance accounted for by each factor. The first rule of thumb is to set the number of factors based on the number of eigenvalues greater than unity (1.0). Another way is to plot (called a scree plot) the 25 eigenvalues to identify a clear breaking point along the eigenvalues.
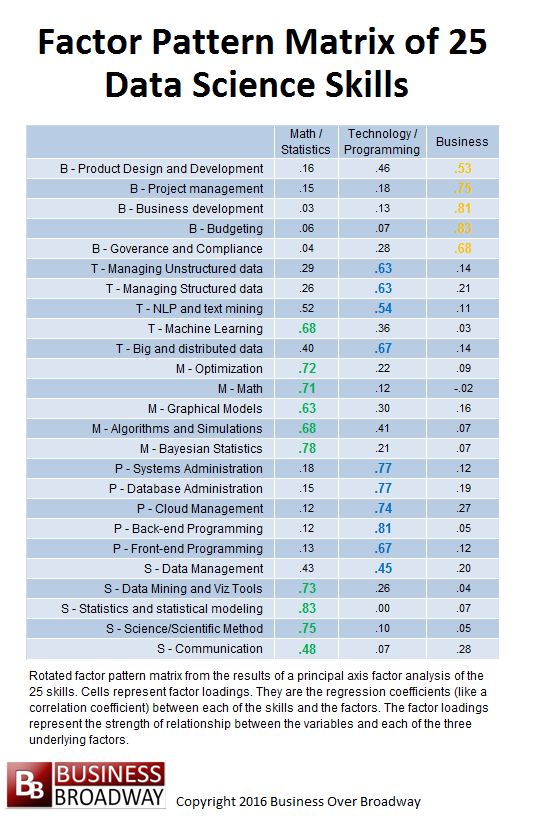
Table 1. Factor pattern matrix (after varimax rotation) of proficiency ratings of 25 data science skills. Click image to enlarge.
The plot of the eigenvalues shows a clear breaking point between the 3rd and 4th eigenvalue (See Figure 2). Therefore, I chose a three-factor solution to explain the relationships among the 25 data science skills. The three factors accounted for 62% of the variance among the 25 data skills.
Based on a 3-factor solution, the factor pattern matrix was easy to interpret. The factor pattern matrix of the factor analysis of the proficiency ratings of the 25 data skills is presented in Table 1.
The cell values in the factor pattern matrix in Table 1 are color-coded to represent the highest value in each row. The three factors’ headings are based on the skills that loaded highest on that factor. For example, many math and statistics skills loaded highly on Factor 1; as a result, I labeled that factor as Math/Statistics. Similarly, based on the skills that were highly related to the other two factors, the other two factors were labeled as Technology/Programming and Business.
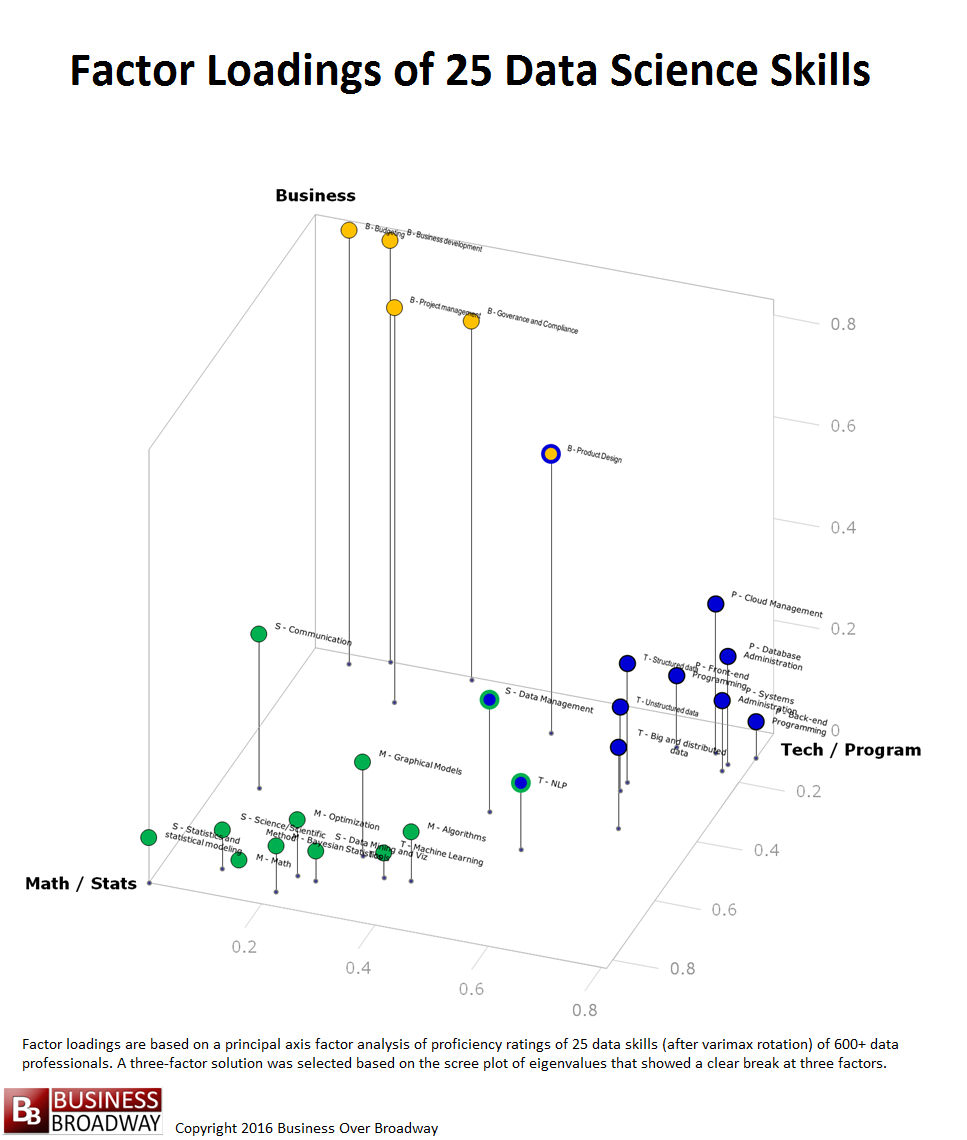
Figure 3. Visual Representation of the Factor Pattern Matrix of the Factor Analysis of the 25 Data Science Skills
Revealing the Structure of Data Science Skills through Visualizations
You can think of these factor loadings for each of the 25 data skills as coordinates in a 3-dimensional space (x, y and z). By plotting the 25 data skills using these values, you can see a visual representation of the three underlying data science skills. This visualization of the factor loadings appears in Figure 3. Each point in the figure represents a specific data science skill. Each skill is color-coded to represent the skill area with which it is associated. Math/Statistics is colored green. Business is colored yellow. Technology/Programming is colored blue. Additionally, to help you see a 3D perspective, I included a drop line for each point that represents its z-axis value.
You can see how the 25 data science skills cluster into three distinct groups (i.e., factors), each representing a skill area. A few of the skills had some high loadings on more than one factor. These are coded in multiple colors. These skills included Product Design (loads on Business and Technology/Programming), Data Management (loads on Technology/Programming and Math/Statistics) and NLP and text mining (loads on Technology/Programming and Math/Statistics).
I created an animated version of Figure to help you see the factor loadings from different angles (see below).
Summary
While the field of data science is made up of many different types of skills, we found that data science skills can be divided into three meaningful areas: subject matter expertise (in this study, business knowledge), technology/programming and math/statistics. A factor analysis of proficiency ratings of 25 different data science skills revealed a clear 3-factor solution.
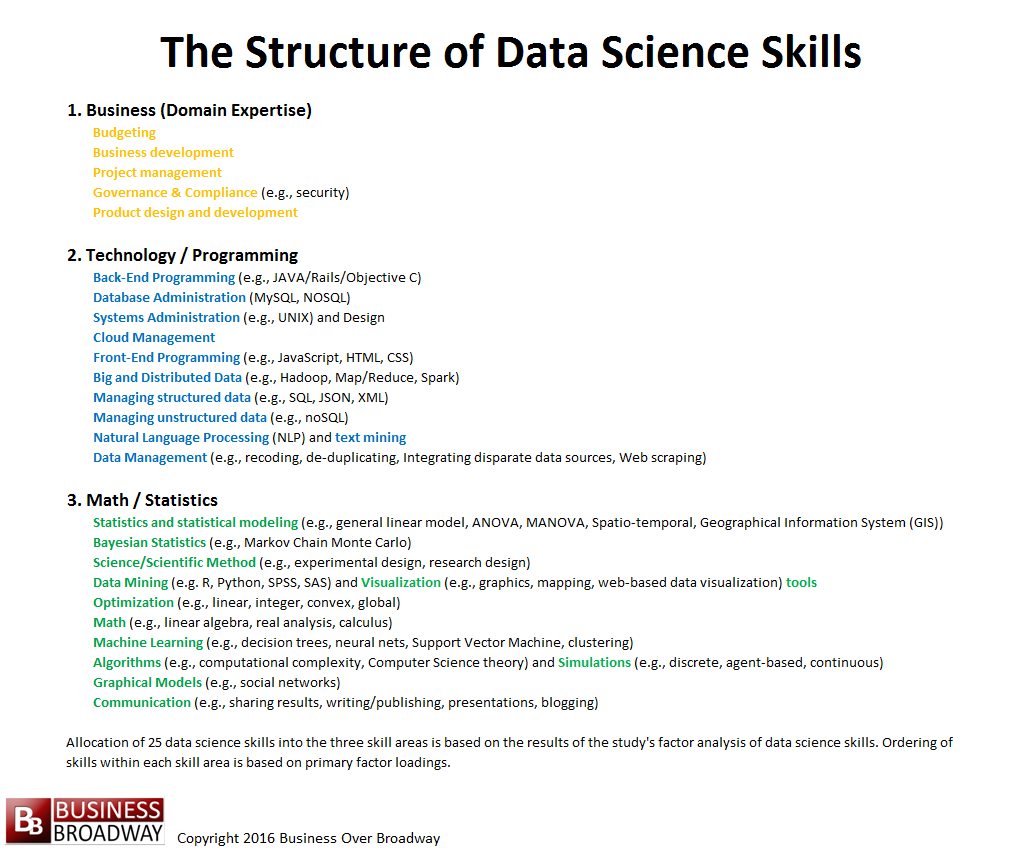
Figure 4. The Structure of Data Science Skills. Click image to enlarge.
The results have a couple of implications for both data professionals and recruiters. If you are a data professional, what data skills do you need? Our results showed that, within the three broad skill areas, data professionals who are proficient in a skill tend to be proficient in other related skills. Therefore, I recommend you first understand your strengths. If you have a strong math/statistics background, you might consider taking courses in that area. If you already have strong skills in statistics and statistical thinking, it might be easier for you to learn related skills (e.g., machine learning) than, say, front-end programming.
If you are a recruiter, the success of your business rests on how well you can match your candidate’s skills to the job requirements of your clients’ job openings. There are many different skills that make up math/statistics and technology/programming. Be sure you understand the specific skills your candidates possess. You might use the list of skills in Figure 4 as a starting point to assess your candidates’ skills.
 At AnalyticsWeek, we are helping job seekers and recruiters find each other through our skills-based assessment. Based on our research findings of this assessment tool, we developed the Data Talent Draft, a monthly event, where would-be data scientists pit their skills against others for a chance of getting drafted by recruiters for further interview. Job seekers and recruiters can sign up here.


