
This is Part 3 of a series on the Development of the Customer Sentiment Index (see introduction, Part 1 and Part 2). The CSI measures the degree to which customers hold positive/negative attitude about your company/brand. The CSI is based on a single survey question that asks customers to use the best word to describe the company/brand. This post explores what the CSI is measuring and will begin to identify how the CSI can be used to gain insight to improve the customer experience.
In my previous posts about the Customer Sentiment Index (see Part 1 and Part 2), I created five sentiment lexicons; I found that there was generally moderate to high agreement among sentiment lexicons. While each lexicon generates different sentiment values for specific words, each tells you pretty much the same thing. That is, even though there is generally high agreement across different sentiment lexicons, there are mean differences in sentiment values across different lexicons. The bottom line is that sentiment extraction from words results in systematic and reliable differences of words along a sentiment continuum.
In this post, I will try to understand and clarify what a single word can tell you about the attitude of your customers, essentially telling us what the Customer Sentiment Index (CSI) is measuring. The study samples (i.e., B2B and B2C) allow me to take a look at the usefulness of the metric in a business setting. Toward this end, I will use the CSI in two studies (same samples used in prior post) to examine the correlation of the CSI with other commonly used customer metrics, including likelihood to recommend (e.g., NPS), overall satisfaction and CX ratings of important customer touch points (e.g., product quality, customer service). Identifying what is and is not correlated with the CSI will help to clarify its meaning.
Samples and Measures
In the first study, as part of an annual customer survey, a B2B technology company collected customer feedback in their annual customer survey. The customer survey included questions that required customers to provide ratings (0 – low to 10 – high) on measures of customer loyalty (e.g., overall satisfaction, likelihood to recommend, likelihood to buy different products, likelihood to renew) and satisfaction with the customer experience (e.g., product quality, sales process, ease of doing business, technical support).
Additionally, the survey included the question to calculate the CSI: “Using one word, please describe COMPANY’S products/services.” Five CSI scores were calculated using the different sentiment lexicons developed earlier. From 1619 completed surveys, 894 customers provided an answer for the question. Many respondents used multiple words or the company’s name as their response, reducing the number of useful responses to be 689. Of these respondents, a total of 251 usable unique words were used by respondents.
In the second study, as part of a customer relationship survey, I solicited responses from customers of wireless service providers (B2C sample). The sample was obtained using Mechanical Turk by recruiting English-speaking participants to complete a short customer survey about their experience with their wireless service provider. The survey included the aforementioned questions measuring customer loyalty and satisfaction with CX touch points.
The following question was used to generate the CSI: “What one word best describes COMPANY? Please answer this question using one word.” Five CSI scores were calculated using the different sentiment lexicons developed earlier. From 469 completed surveys, 429 customers provided an answer for the question, Many respondents used multiple words or the company’s name as their response, reducing the number of useful responses to be 319. Of these respondents, a total of 85 usable unique words were used by respondents.
Results for B2B Sample
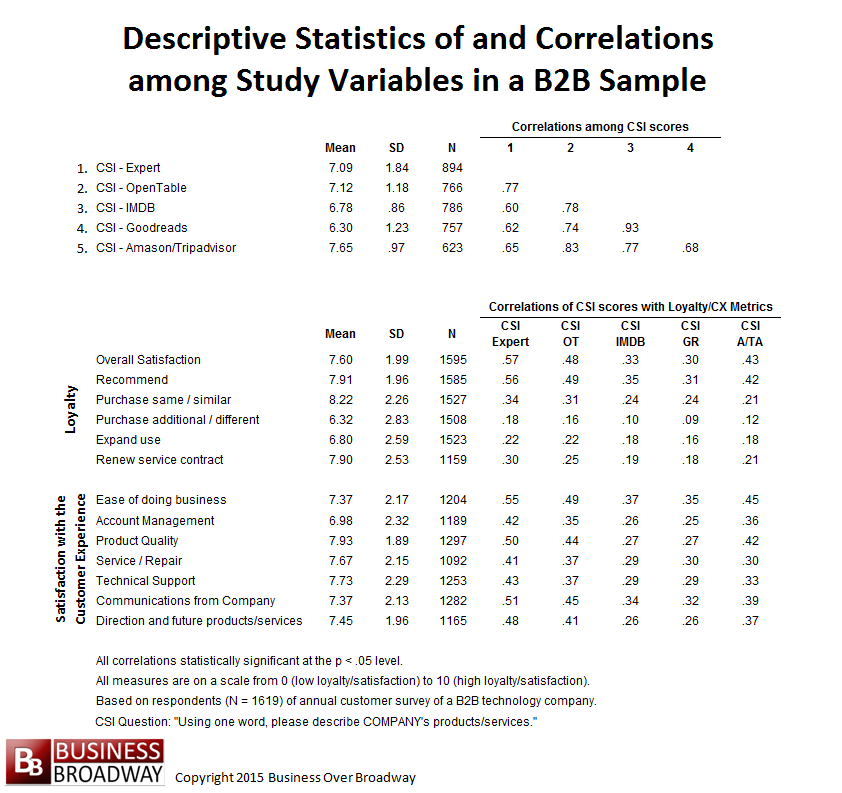
Table 1. Descriptive Statistics of and Correlations among Study Variables in a B2B Sample
The descriptive statistics for and correlations among the study variables in first sample are located in Table 1. Looking at the top part of Table 1, the five different CSI scores (each based on a different sentiment lexicon) are correlated strongly with each other (average r = .74), the correlations ranging from a low of r = .60 (Expert compared to IMDB) and r = .62 (Expert compared to Goodreads) to a high of r = .93 (IMDB compared to Goodreads) and r = .83 (OpenTable compared to Amazon/TripAdvisor). A factor analysis of the five CSI scores shows a clear one-factor solution (one eigenvalue over 1.0), with the first factor accounting for almost 82% of the common variance. These pattern of results show that each of the CSI scores measure the same underlying construct.
There were statistically significant differences across each of the five CSI score means. All paired t-tests for each of the 10 paired combinations of the CSI scores were statistically significant (p < .01). The absolute sentiment values you get for the CSI depend on the sentiment lexicon you use. CSI scores are the highest when the Amazon/TripAdvisor lexicon is used and the lowest when the Amazon/Goodreads lexicon is used.
Looking at the bottom part of Table 1, we see the descriptive statistics for the other study variables (loyalty and CX measures) and their correlations with each of the CSI scores. CSI scores were positively related to each of the customer loyalty measures. Customers who have higher CSI scores also report higher levels of customer loyalty compared to customers with lower CSI scores. Additionally, CSI scores were more highly correlated (average r = .37) with advocacy loyalty (i.e., overall satisfaction, recommend, buy same) than with purchasing (i.e., buy additional, expand use) and retention (i.e., renew) loyalty (average r = .18).
CSI scores were positively related to each of the CX measures. Customers who have higher CSI scores also report higher levels of satisfaction with different CX touch points compared to customers with lower CSI scores. Additionally, CSI scores were more highly correlated (average r = .41) with ease of doing business, product quality and communication from the company than with the other CX touch points (average r = .34).
Of the five different CSI scores, CSI-Expert scores showed higher correlations (average r = .42) with each customer loyalty and CX measure compared to the other CSI scores. CSI-Goodreads scores (average r = .26) and CSI-IMDB scores (average r = .27) had the lowest correlations with those same loyalty and CX measures.
Results for B2C Sample
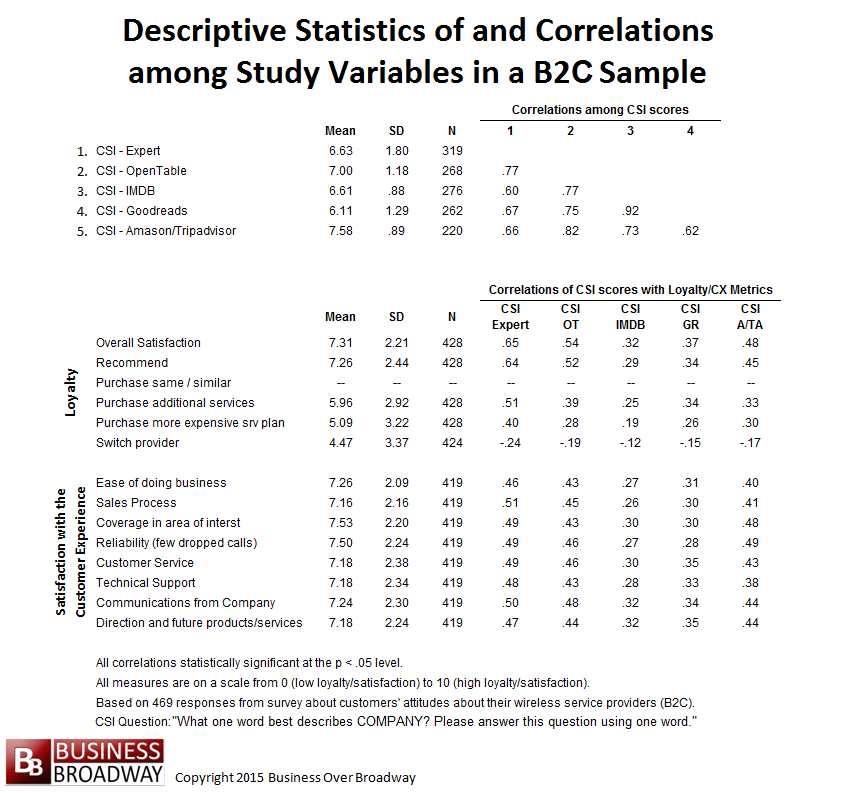
Table 2. Descriptive Statistics of and Correlations among Study Variables in a B2C Sample.
The descriptive statistics for and correlations among the study variables in second sample are located in Table 2. The results for the B2C sample (here) are similar to the results of the B2B sample (prior). Looking at the top part of Table 2, the five different CSI scores (each based on a different sentiment lexicon) are correlated strongly with each other (average r = .73), the correlations ranging from a low of r = .60 (Expert compared to IMDB) and r = .62 (Amazon/Tripadvisor compared to Goodreads) to a high of r = .92 (IMDB compared to Goodreads) and r = .82 (OpenTable compared to Amazon/TripAdvisor). A factor analysis of the five CSI scores shows a clear one-factor solution (one eigenvalue over 1.0), with the first factor accounting for almost 70% of the common variance. These pattern of results show that each of the CSI scores measure the same underlying construct.
There were statistically significant mean differences across each of the five CSI scores. Paired t-tests for each of the 10 paired combinations of the CSI scores were statistically significant (p < .01). Similar to the B2B sample results, CSI scores are the highest when the Amazon/TripAdvisor lexicon is used and the lowest when the Goodreads lexicon is used.
Table 2 (bottom part) contains the descriptive statistics for the other study variables (loyalty and CX measures) and their correlations with each of the CSI scores. Results show that CSI scores were positively related to each of the customer loyalty measures. Customers who have higher CSI scores also report higher levels of customer loyalty compared to customers with lower CSI scores. CSI scores were more highly correlated (average r = .46) with advocacy loyalty (i.e., overall satisfaction, recommend, buy same) than with purchasing (i.e., buy additional, buy more expensive) and retention (i.e., switch – reverse coded for average) loyalty (average r = .27).
CSI scores were positively related to each of the CX measures. Customers who have higher CSI scores also report higher levels of satisfaction with different CX touch points compared to customers with lower CSI scores. Additionally, there is not a lot of variability in correlations across the different CX touch points within CSI scores. However, there are big differences across CSI scores; CSI-Expert scores showed higher correlations (average r = .49) with each customer loyalty and CX measure compared to the other CSI scores. CSI-Goodreads scores (average r = .31) and CSI-IMDB scores (average r = .27) had the lowest correlations with those same loyalty and CX measures.
Settling on a Final Sentiment Lexicon for the CSI
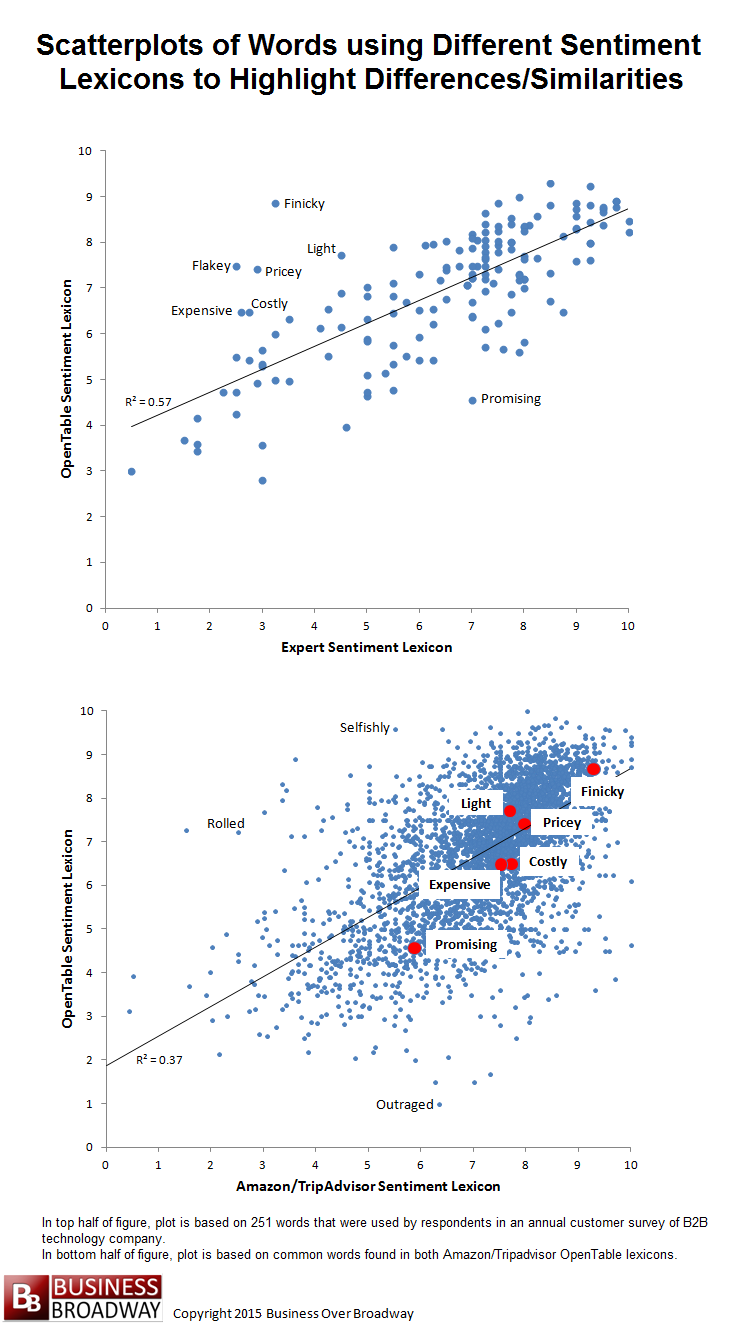
Figure 1. Scatterplot of Words’ Sentiment Values based on Different Sentiment Lexicons
There was generally high agreement between the Expert-derived and the OpenTable sentiment lexicons in scaling words along the sentiment continuum. Using these two lexicons as a starting point for use in calculating the CSI makes sense as each provides roughly the same information about words. However, the sentiment values of a few words were wildly different (i.e., were on opposite sides of the sentiment continuum). For example (see Figure 1, upper plot), the experts classified the word, “Expensive,” as holding a negative sentiment (CSI-E = 2.6) while the empirically-derived sentiment approach based on the OpenTable words classified the same word as holding a positive sentiment (CSI-OT = 6.48). There were a handful of words, like Finicky, Light, Pricey, Costly and Flakey, that showed a similar pattern of results in that the experts thought the words were negative but OpenTable assigned the words as positive. When comparing these words using the Amazon/Tripadvisor and OpenTable sentiment lexicon (Figure 1, bottom plot, red points), we see that these words are generally positive in both sentiment lexicons.
Because of the agreement of other lexicons for handful of words, I created a single sentiment lexicon from the OpenTable and Expert lexicon by allowing the OpenTable sentiment value to be the default sentiment value for the word. For each word that is not in the OpenTable lexicon, the Expert sentiment value was used to assign a sentiment value to each word. This combined sentiment lexicon was used to recalculate sentiment for the respondents in both studies (CSI-BOB).
As I develop the sentiment lexicon(s) for the CSI, I will incorporate survey ratings provided by customers as part of the sentiment lexicon. In fact, of the 19 customers who used the word “Expensive” in the B2B sample, their overall satisfaction rating with the company was 6.58 (positive), similar to the OpenTable value and quite different from the Expert value.
Using CSI to Identify At-Risk Customers
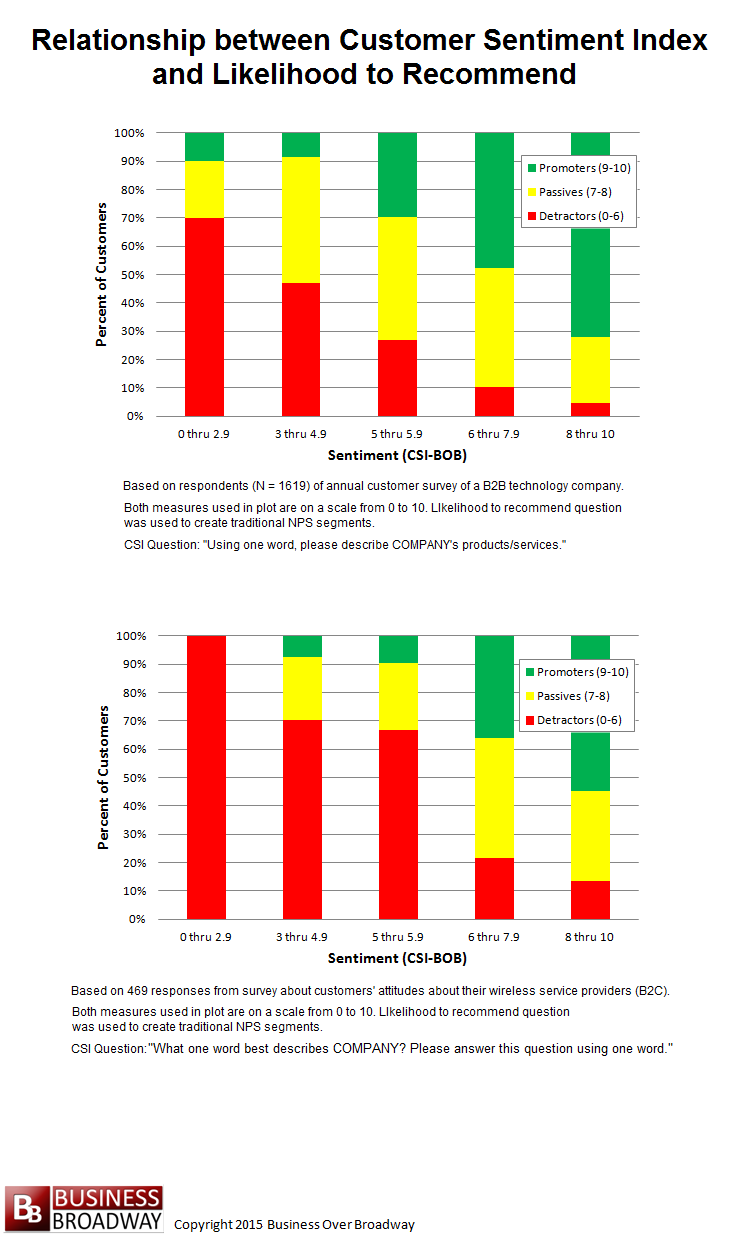
Figure 2. Relationship between the CSI-BOB and Likelihood to Recommend for both (B2B and B2C) study samples.
Customer surveys can be used to identify at-risk customers. “At-risk” is defined as those customers who will exhibit disloyal behaviors (e.g., switch) or those who will not exhibit loyalty behaviors (e.g., not recommend). Using the CSI to identify at-risk customers, we need to identify a useful cut-off point along the CSI continuum. This cutoff point defines the line below which customers are likely to be disloyal and above which customers are likely to be loyal.
To illustrate the relationship between customer sentiment and customer loyalty, I examined the relationship between CSI-BOB and the likelihood to recommend question (see Figure 2). The recommend question was grouped into segments made popular by the Net Promoter Score: Detractors, Passives and Promoters.
The relationship between the CSI and recommendation intentions was more linear for the B2B sample (top plot) compared to the B2C sample (bottom plot). For the B2B sample, the CSI cutoff point at which most respondents become Detractors is around 3.0. For the B2C sample, the comparable cutoff point for the CSI is around 6.0.
Summary
This series of articles covered the development of the Customer Sentiment Index (CSI), a methodology to capture customers’ sentiment using a single word.
The CSI was positively correlated with all customer loyalty and CX metrics. Customers with higher customer sentiment reported higher levels of customer loyalty and were more satisfied with their customer experience. The CSI was more closely associated with advocacy loyalty (e.g., overall satisfaction, likelihood to recommend) than with other types of loyalty and CX metrics, suggesting that the CSI measures customers’ general attitude toward the company.
As part of a customer experience management programs, businesses need to identify at-risk customers so they can address their concerns immediately. I showed that the CSI can be used to reliably identify at-risk customers (e.g., not likely to recommend). Setting the right cutoff point that optimizes the identification of loyalty and disloyal customers varied across the B2B and B2C samples. Future research needs to confirm or disprove this finding.
Asking customers to describe your company using one word appears to hold some value in helping businesses understand and manage the customer relationship. The Customer Sentiment Index (CSI) provides reliable, valid information about customers’ sentiment. The results showed that the CSI measures customers’ general attitude about your company/brand. The CSI is predictive of important organizational metrics like recommendation, purchasing and switching intentions.
I will continue exploring different uses of the CSI to show how companies can use this metric in their customer experience management programs.


