
Are you spending nearly half the time generating and preparing reports of your data? Tired of putting it all together into presentable formats by exporting, formatting & beautifying? Well, you no longer have to! Thanks to Google Data Studio, a reporting tool that has transformed the way digital marketers present data. Wondering what makes Google Data Studio different from the rest? Let’s take a look at how it can be a saviour for marketers.
What is Google Data Studio?
Google Data Studio is a data reporting and visualization software tool that helps turn data into structured, visually appealing & most importantly easy to read reports. Not convinced yet? This smart tool by Google also lets you customize your reports as per your brand specifications & color guidelines & is absolutely free. Go ahead and create unlimited reports with ease
Why Google Data Studio?
Data reporting and management has always been a major challenge for marketers. Working with huge amounts of data from multiple sources & building reports for all demands some serious amount of time & effort. Here’s why you should use Google Data Studio to make life simpler!
- Extracts data from multiple sources Google Data studio pulls data from various sources right from File upload, Google AdWords Attribution 360, BigQuery, Cloud SQL, DCM, DFP, Google Analytics, Google Sheets, MySQL, PostgreSQL, Search console, YouTube analytics.
- Customize your reports Google Data studio lets you create pie charts, graphs, tables etc. to present your data. Not just that, you could also play around with the fonts & colors as per your brand guidelines, by giving it a much more professional look!
- Easy to share Once done creating, you could share your Google Data Studio report with anybody by just sharing the link of the report, just like a Google Doc. Yes, it is as simple as it sounds.
- Create unlimited reports for FREE Need we say more?
How to use Google Data Studio?
Before you get started with creating a report, you first need to –
- Sign in to your Google account
- Gather the data you want to generate a report for in any format that can be easily extracted by Google Data Studio tool (i.e Google Analytics, Adwords, Sheets etc.)
Step by Step guide to Google Data Studio
-
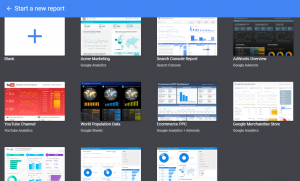
- Select a template for your report to get started with. You could either use an existing template from the list or create your own using the ‘Blank’ option based on your requirements as seen in the image below. Quick tip: If you have less time, go for a pre-fixed template as that can also be customized to an extent.
- Click on the ‘Get Started’ button on the welcome page & accepting the terms & conditions & choose your preferences.
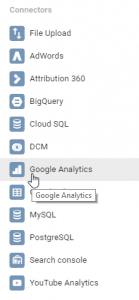
- Select your data source Once you create your template, you will be asked to select your data source. You could either choose from the files owned by you, shared with you or create a new data source from the list. The list will include sources such as the following –
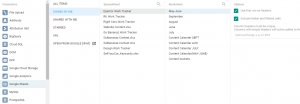
- Start building your report after you choose or create your data source. Let’s say we choose Google sheets from the list. The preview would look similar to the dashboard below. Once selected, click on ‘Connect’. Next, you will see a list of metrics and dimensions, which you can add to the report. Click on ‘Add to Report’ once done. This will take you to the report dashboard.
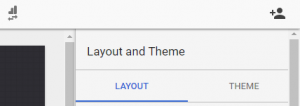
- Here’s our most favorite part! This step will involve creating your own layout & theme for the report using the tools displayed on the toolbar right on top of the canvas. Select a layout & theme for the report from the tab on the right, give your report a title. Explore all the features from pull-down menu, toolbar and the Properties Panel on the right side in order to configure your charts. Ready to bring out the artist in you?
- Once done creating the report, click on the ‘Share’ icon on the top right hand corner of the dashboard. Enter the email address of the person you want to share the report with & grant ‘Edit’ or ‘View’ access.
Exporting your Google Data Studio reports
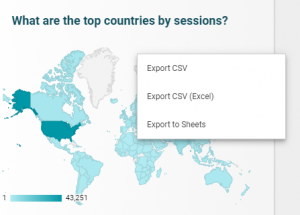
The current version of Google Data Studio only allows you to export separate sections of the dashboard such as individual pie charts, bar graphs etc. This can be done by hovering over the desired section of the report, right clicking on it & selecting a format to export the data in (CSV, CSV Excel, Sheets)
The entire dashboard cannot be exported at once, which is a limitation.
Dynamic Reporting with Google Data Studio
Report created with Google Data Studio are dynamic in nature, as they get updated with the most latest data input given by the user. Every time there is a change in the information provided, the report automatically get updated in real time.
This is most helpful when using data sources such as Google Sheets or Google Analytics in which data is updated as per the user’s input, which gets reflected in the Google Data Studio report. Saves a lot of time, doesn’t it?
Commercials & Pricing
As mentioned above, Google Data Studio tool is made available to users for FREE. One can now create & share unlimited reports with complete access to all of it’s features & actions.
Choose the competition if you are an agency
Google data Studio is a great platform for reporting your digital marketing efforts. But there are some features that are not available in this free platform such as:
- Support for cost margins – fixed, basic and absolute
- Language pack customizations to apply across all clients
- Display text ads, image ads and responsive ads and posts in social media
- Scheduling reports (with logos, client name and agency name)
- Easy to select date ranges and compare data in the same widget
- One click publish/remove to client portal
- Customizable cover pages
- Download as pdf and excel not available currently in data studio
- Multi data source widgets
These features are required by digital ad agencies since there will be handles multiple accounts of multiple clients.
Quick Insights & takeaways
You no longer have to invest hundreds of dollars in data management & reporting software’s as Google Data Studio is here to win! Creating stunning, professional looking reports doesn’t require you to be a Graphic Designer. With the help of just a few clicks, create beautiful, customized reports that are easy to read & easy to share. This tool has got you covered!
But this tool will be great based on your requirement. If you’re an in-house marketer for a small or large enterprise, a freelancer, or a digital marketing learner, this is the tool for your reporting needs. If you are an agency with multiple clients, then ditch this and look at tools such as RavenTools, Searchmetrics, or platforms like ReportGarden
You could also follow my blog on ISPIRT , ReportGarden, and IndianCEO.


