
In previous posts, we learnt how to use data for improvement of the Customer Value we create and for communicating our Value. We also discussed how to put together a Customer Value Improvement plan. We looked at what the data meant on a global scale (that is how you can rate your CVA score with global companies), and the data that exists for various industries.
In this post, we show how the Customer Value data (CVA) relates to business results.
The Vodafone Managing Director for Australia, David Maher said that the Customer Value Added scores predicted market share to within 1% accuracy, and that it predicted Customer churn accurately. Maher’s Financial Director stated that the Customer Value score was more accurate than the financial scores.
With this kind of a recommendation, why is Customer Value Added not being used more frequently? Part of the reason is that satisfaction studies are more entrenched and prevalent. People who use them do not realise that satisfaction does not relate to loyalty. CSat is a great way to measure transactions but not value. The experience of the transaction is captured. But often you want to assess something that has not happened, like the expectation of a retailer that your company will bring out new products, and provide more business to them. This cannot be captured by an experience or a satisfaction study.
Once you have decided on the Value Priority for improvement, then the satisfaction data can be a useful measure to check improvements. You focus your satisfaction study on those items that have a Value Priority for improvement
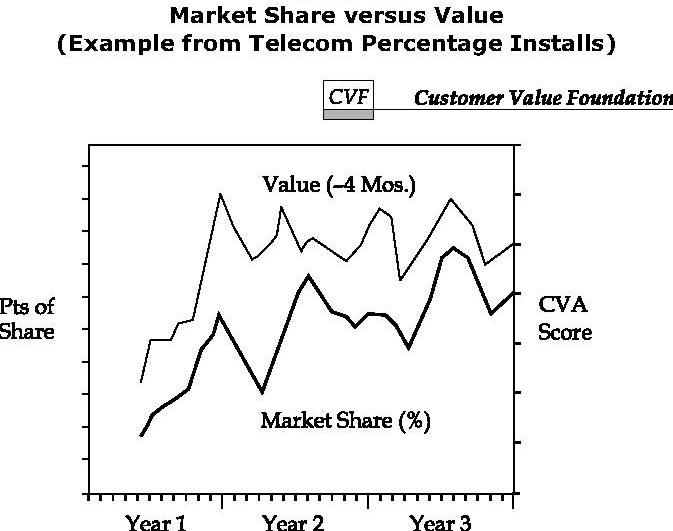
Customer Value studies also correlate to business results. The Customer Value Added data has a one on one correlation with the market share. The results are seen (in this example 4 months later) sometime after the Value addition has been made by the company, because it takes time for the new value to rollout into the market place.
The next figure shows how Customer retention increases as Customer Value increases.
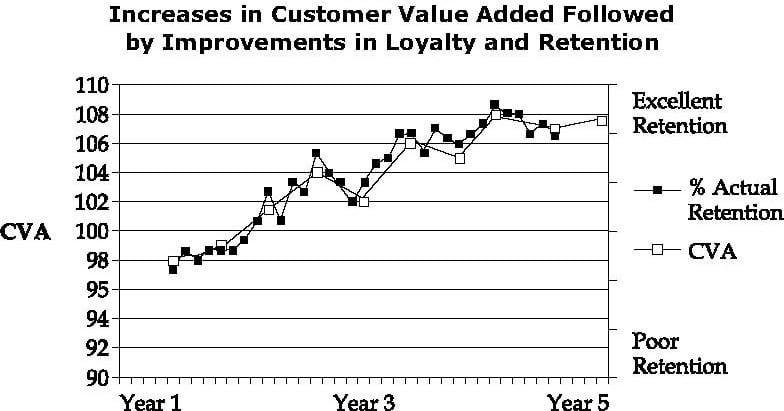
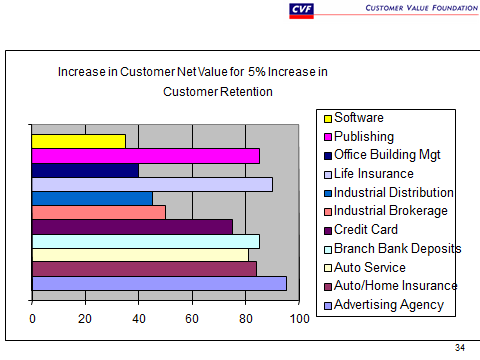
As you can see loyalty and retention increased as the Customer Value score increased. The figure below shows that the profit increases as retention increases. Specifically in this example, a 5% increase in retention translates to 25 50 100% increase in profit. Part of the profit increase comes because as Customer Value Added increases, prices you can charge can increase. Further, your market share increases. Thus your profit increases.
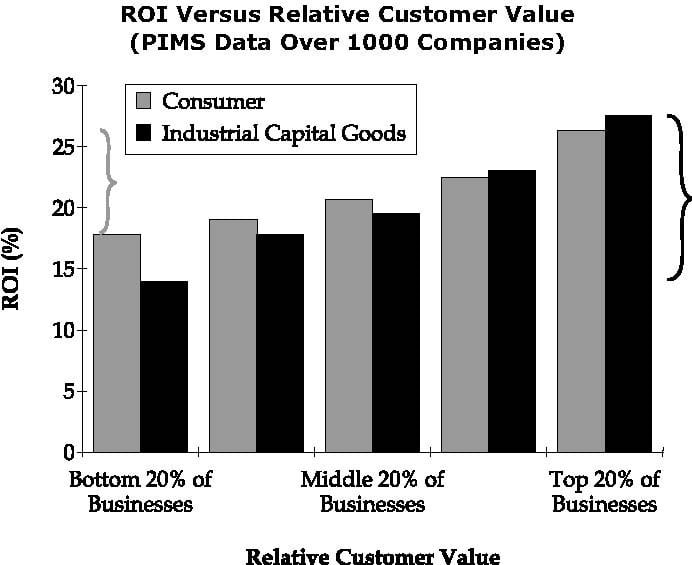
The next chart (Figure 6-5) shows that share of wallet increases as CVA increases
It obviously follows that if market share is increasing and retention is increasing, wallet share is increasing, the top line should increase and ROI increases.
Obviously if Customer Value goes up and ROI goes up, share prices should go up also. In a 10 year study by Claes Fornell of U of Michigan showed a 1% increase in satisfaction increased share price by 4.6%
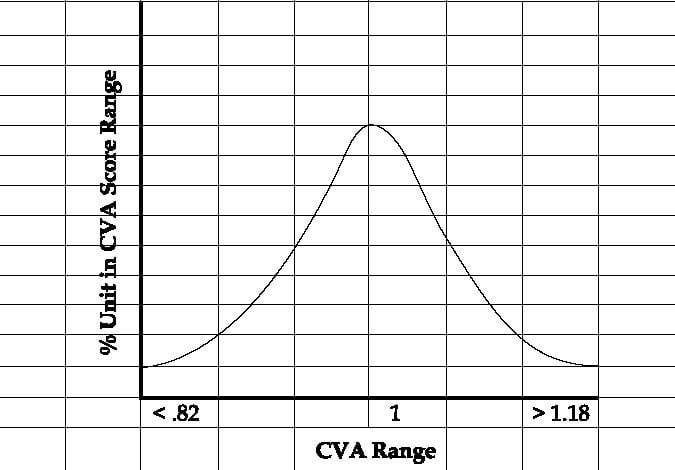
Lastly, if we take a large customer base, the CVAs for each industry will follow a bell curve or a Gaussian distribution as shown below in Figure 6-6
Discussion
So you can see the value of Customer Value Added. You had intuitively always bought a product based on its value relative to competition. Now you can see the business results:
- Loyalty and retention goes up
- Wallet share increases.
- Market share increases.
- Customers are willing to give a higher price to products they believe are giving them increased Customer Value Added.
- Because you are closer to the customer, you will make fewer errors and become more efficient, and hence costs should go down.
- Profits and ROI will increase. Consequently share prices will go up.
In the next post, we shall look at loyalty curves and also value maps, all derived from the Customer Value Added studies.
Do it Yourself
Ask yourself if you buy based on value? Think of times you have bought or made your purchasing decisions based on value, and when you have not.
Have you noticed you are willing to give a higher price for something that gives you higher perceived value? For example for an Apple phone versus a similar phone from another brand?
Do you tend to use the same credit card most of the time? That means that card has a greater share of your wallet. Can you think of other items or companies which have a higher share of wallet. You have 2 cars, you tend to use one more often. Why? Is this related to value?
If you look at products you buy, think of those you buy on impulse, those you must buy right away, and those you have time to buy. Where does Customer Value perception come into your purchase? How important are emotions in buying?
Take a product you are selling or buying. How could Customer Value be improved?
Do you always buy the cheapest product or the most expensive one? Why?


