
Driving real value with analytics is much harder than people assume. Doing it well requires solving two separate, equally thorny problems. The first – fairly obvious problem – is being able to use data to deepen your understanding of important business questions. That’s what analytics is all about. The second problem is being able to use that understanding to drive business change. Affecting change is a political/operational problem that’s often every bit as difficult as doing the actual analysis. Most people have a hard time understanding what the data means and are reluctant to change without that understanding. So, giving analysts tools that help describe and contextualize the data in a way that’s easy to understand is a double-edged sword in the best of ways – it helps solves two problems. It helps the analyst use the data and it helps the analyst EXPLAIN the data to others more effectively. That’s why having a rich, powerful, UNDERSTANDABLE set of store metrics is critical to analytic success with in-store customer tracking.
Some kinds of data are very intuitive for most of us. We all understand basic demographic categories. We understand the difference between young and old. Between men and women. We live those data points on a daily basis. But behavioral data has always been more challenging. When I first started using web analytics data, the big challenge was how to make sense of a bunch of behaviors. What did it mean that someone viewed 7 pages or spent 4.5 minutes on a Website? Well, it turned out that it didn’t mean much at all. The interesting stuff in web analytics wasn’t how many pages a visitor had consumed – it was what those pages were about. It meant something to know that a visitor to a brokerage site clicked on a page about 529 accounts. It meant they had children. It meant they were interested in 529 accounts. And depending on what 529 information they chose to consume, it might indicate they were actively comparing plans or just doing early stage research. And the more content someone consumed, the more we knew about who they were and what they cared about.
Which was what we needed to optimize the experience. To personalize. To surface the right products. With the right messages. At the right time. Knowing more about the customer was the key to making analytics actionable and finding the right way to describe the behavior with data was the key to using analytics effectively.
So when it comes to in-store customer measurement, what kind of data is meaningful? What’s descriptive? What helps analysts understand? What helps drive action?
The answer, it turns out, isn’t all that different from what works in the digital realm. Just as the key to understanding a web visit turns out to be understanding the content a visitor selected and consumed, the key to understanding a store visit turns out to be understanding the store. You have to know what the shopper looked at. What was there when they stopped and lingered. What was along the corridor that they traversed but didn’t shop. You have to know the fitting room from the cash-wrap and an endcap from an aisle and you have to know what products were there. What’s more, you have to place the data in that context.
Here’s what the data from an in-store measurement collection system looks like in its raw form, frame by frame:
| Time | X | Y |
| 04:06.0 | 35 | 60 |
| 06:50.0 | 9 | 66 |
| 09:10.0 | 23 | 74 |
| 11:02.0 | 18 | 92 |
| 11:35.0 | 33 | 98 |
| 13:15.0 | 28 | 74 |
| 14:25.0 | 7 | 81 |
| 16:16.0 | 41 | 75 |
| 19:09.0 | 49 | 62 |
| 21:03.0 | 45 | 72 |
| 23:23.0 | 55 | 83 |
| 23:58.0 | 54 | 90 |
| 24:09.0 | 40 | 86 |
| 25:05.0 | 15 | 90 |
| 27:24.0 | 7 | 79 |
| 27:45.0 | 43 | 99 |
| 28:42.0 | 37 | 97 |
| 29:25.0 | 45 | 80 |
| 32:07.0 | 47 | 75 |
| 33:05.0 | 16 | 77 |
| 35:31.0 | 37 | 65 |
| 36:08.0 | 34 | 75 |
| 36:33.0 | 9 | 73 |
| 39:16.0 | 35 | 76 |
| 40:07.0 | 13 | 97 |
That’s a visit to a store. A little challenging to make sense of, right?
It’s our job to translate that into a journey with the necessary context to make the data useful.
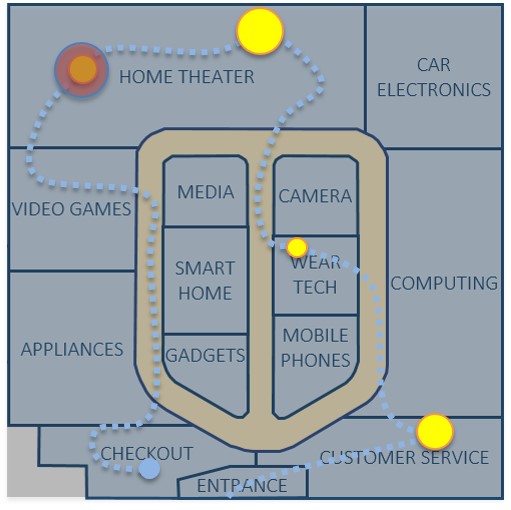
That starts by mapping the data onto the store:

By overlaying the measurement frames, we can distinguish the path the user took through the store:

With simple analysis of the frames, we can figure out where and when a customer shifted from navigating the store to actually spending time. And that first place the shopper actually spends time, has special significance for understanding who they are.
In DM1, the first shopping point is marked as the DRAW. It’s where the shopper WENT FIRST in the store:
In this case, Customer Service was the Draw – indicating that this shopping visit is a return or in-store pickup. But the visit didn’t end there.
Following the journey, we can see what else the customer was exposed to and where else they actually spent time and shopped. In DM1, we capture each place the shopper spent time as a LINGER:

Lingers tell us about opportunity and interest. These are the things the shopper cared about and might have purchased.
But not every linger is created equal. In some places, the shopper might spend significantly more time – indicating a higher level of engagement. In DM1, these locations are called out on the journey as CONSIDERS:

Having multiple levels of shopper engagement lets DM1 create a more detailed picture of the shopper and a better in-store funnel. Of course, one of the keys to understanding the in-store funnel is knowing when a shopper interacts with an Associate. That’s a huge sales driver (and a huge driver – positive or negative – to customer experience). In DM1, we track the places where a shopper talked with and Associate as INTERACTIONS. They’re a key part of the journey:

Of course, you also want to know when/if a customer actually purchased. We track check-outs as CONVERSIONS – and have the ability to do that regardless of whether it’s a traditional cash-wrap or a distributed checkout environment:

Since we have the whole journey, we can also track which areas a customer shopped prior to checkout and we’ve created two measures for that. One is the area shopped directly before checkout (which is called the CONVERSION DRIVER) and the other captures every area the customer lingered prior to checkout – called ATTRIBUTED CONVERSIONS.
To use measurement effectively, you have to be able to communicate what the numbers mean. For the in-store journey, there simply isn’t a standardized way of talking about what customers did. With DM1, we’ve not only captured that data, we’ve constructed a powerful, working language (much of it borrowed from the digital realm) that describes the entire in-store funnel.
From Visits (shopper entering store), to Lingers (spending time in an area), to Consideration (deeper engagement), to Investment (Fitting Rooms, etc.), to Interactions (Associate conversations) to Conversion (checkout) along with metrics to indicate the success of each stage along the way. We’ve even created the metric language for failure points. DM1 tracks where customers Lingered and then left the store without buying (Exits) and even visits where the shopper only lingered in one location before exiting (Bounces).
Having a rich set of metrics and a powerful language for describing the customer journey may seem like utter table-stakes to folks weaned on digital analytics. But it took years for digital analytics tools to offer a mature and standardized measurement language. In-store tracking hasn’t had anything remotely similar. Most existing solutions offer two basic metrics (Visits and Dwells). That’s not enough for good analytics and it’s not a rich enough vocabulary to even begin to describe the in-store journey.
DM1 goes a huge mile down the road to fixing that problem.
[BTW – if you want to see how DM1 Store Visualization actually works, check out these live videos of DM1 in Action]


