
An easy way to understand Customer Value is to build an attribute tree to illustrate the components of Customer Value. Customer Value normally breaks up into Benefits (or utility) and the Cost.
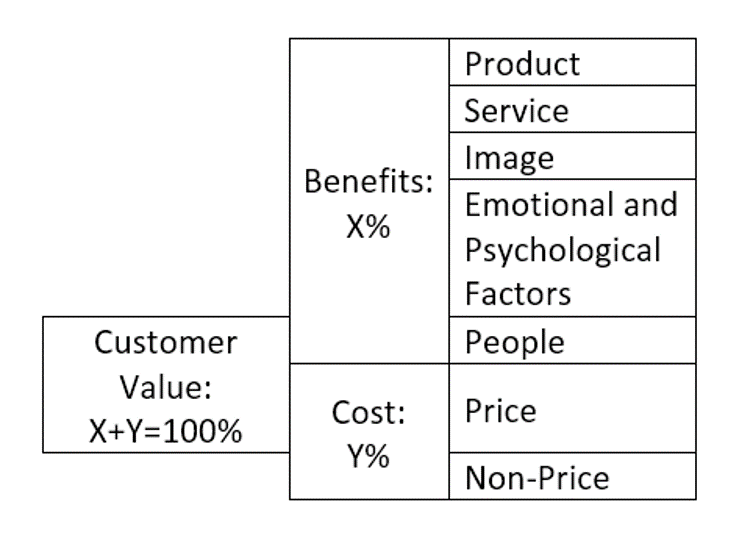
The benefits the Customer derives from the product, the service, the image of the product, emotional and psychological factors in the purchase, from the people of the company or the retailer. Benefits could include other items such as convenience etc. Experience is built into each of these items, and the perception of the Customer is based on many factors including experience, emotions etc. Other factors in benefits could be relationship, or association.
Why do I call emotions a benefit? For example your emotional connect to a product or brand is a benefit you derive (familiarity, liking, experience), and if the company selling the product knew about this, they could influence it.
The Cost is the other parameter that the Customer looks at. Cost is also a perception and breaks up into price and non-price terms. Price terms include the price itself, discounts, interest costs, maintenance or running costs etc.
The non-price terms include price justification, ease of purchase, emotions, time and energy and so forth. Many times, the non-price terms are more important in the buying decision than the price terms. An example is the purchase of greeting cards. Many of us do not buy greeting cards, as the non-price cost of buying (planning to buy, going to the store, parking, buying, mailing) are too high.
You will notice also that the relative importance of the benefits and the cost add up to 100%. In Fig 2.1, the benefits have an importance of X% and the cost an importance of Y%. X+Y add up to 100%.
So benefits could be 20% and cost 80%. Or benefits could be 70% and cost 30%. These numbers are derived from the market research and are not numbers given by the Customer. These percentage numbers are extrapolated from the research data through statistical analysis which will be described later.
Sub-attributes
Likewise in Figure 2.2, we can see that sub-attributes of benefits, each one having an importance percentage shown as A% or B% and so on.
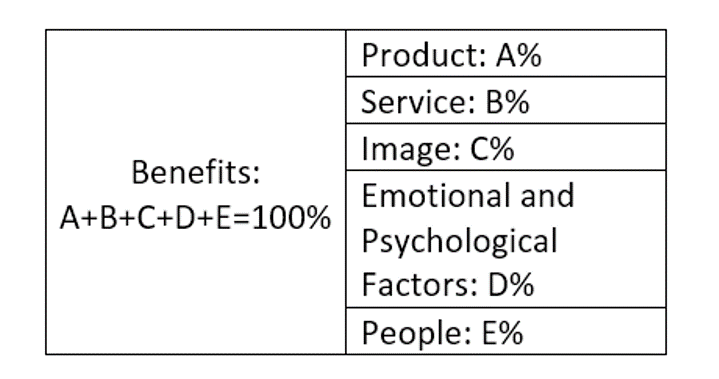
Very often, when there is not much to choose from between competing products, the product importance (A% in this case) could be as low as 5%. On the other hand if your product is well differentiated this number could be 50%. Note that if there is no interaction with the people of the company or the retailer, the people could be of little importance, and could be left out of the attribute tree.
Components of sub-attributes
The product could break up into sub-attributes like the product itself, the product features, and the ease of use, the instructions, the packaging, and the looks. You could add other attributes while removing the ones not of consequence.
The service could consist of the ease of service, the service response, the speed of service, proper and complete servicing, and the service people.
An example of how the sub attributes break out into their components is shown in Fig 2-3 for image. We could have drawn similar trees for Product, service, etc.
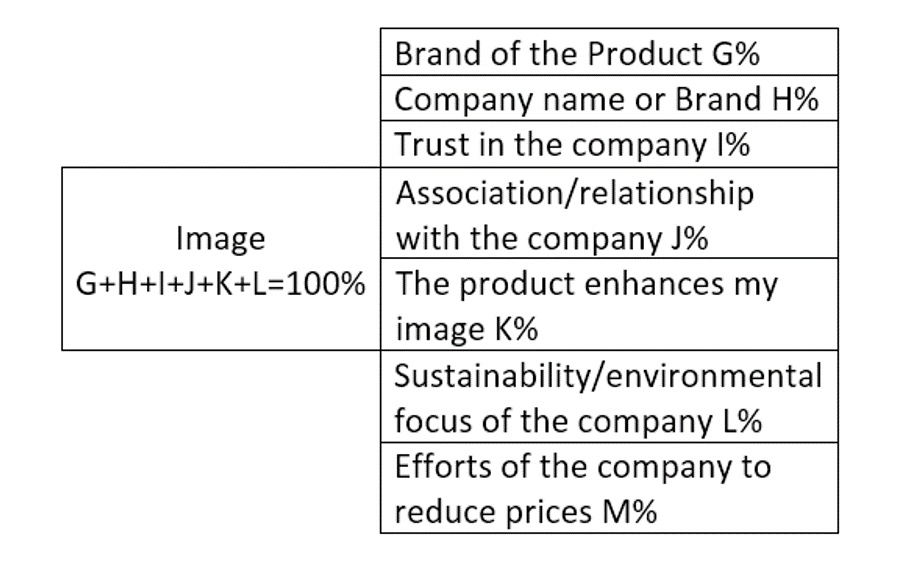
I tend to use image rather than brand, because it is all inclusive. Sometimes the company brand is more important and sometimes the product brand is significant, or the company and the product brand can be similar.
You can see how many factors can make up the image. In a study on a power company we found that the image was 50% of the benefits in Figure 2-2 (shown as C %) and the product, A% was only 20% in importance.
In one study with a power company, the trust in the company, its efforts on sustainability and containing costs were about 75% of the image (I%+L%+M %).
Cost = Price and non-Price
Repeating what we said earlier, Cost is a perception and breaks up into price and non-price terms. Price terms include the price itself, discounts, interest costs, maintenance or running costs etc.
The non-price terms include price justification, ease of purchase, emotions, time and energy and so forth.
For commodities, the cost is more important than the benefits. Generally commodities sell on price, unless you can find ways to de-commoditise them. Adding value to the Customer or differentiating yourself are ways of de-commoditising.
How to make Attribute Trees?
The attribute trees are relatively simple to devise. Sometimes we find that the company people building the attribute trees leave out attributes important to the Customer, or add attributes not important to the Customer. In a subsequent Customer Value added market research such items can be removed if not important or added if the Customer shows this is important.
Waterfall of Needs
Another method to understand the Customer is to build a Customer’s waterfall of needs, and take the attributes from this. The waterfall of needs is really a Customer Journey from the time he thinks of purchase through the purchase and finally the use experience. This is shown in Figure 2-4.

I built this waterfall of needs after I made the attribute trees (I should have built the waterfall first). Even so, I notice that benefits should have included information, the retailer, the availability of the product, some non-price terms etc. that could be important enough to put on the attribute tree. Note we have also mapped out the Customer Journey.
So you can see there are many factors or attributes in buying. The relative importance of these to the Customer is the key to what value you need to be selling. And, as we will show later, you must be better than competition in those factors that are important to improve your Customer value to the Customer. We will discuss this and Customer Value Added in the next chapter.
In next post, we will add our perception of the scores that our company will get from Customers, and what our competitors will get from their Customers.
Discussion
You have been able to see how we can build a Customer’s waterfall of needs and attribute trees, and what items to put on the attribute trees. We have also learnt that each item has a relative importance and that the true importance comes from market research with Customers through statistical analysis.
Do it yourself
All readers have real life examples of what the attribute trees should be, depending on the product or industry. The attribute tree for insurance will be different from buying a car or a mobile phone. Do add yours. Do the following:
- Create a waterfall of needs for a product or service you want to buy or just bought
- Create an attribute tree for a specific industry or product or service that you use or buy
- Put the relative importance of each attribute or sub attribute as you see it
- Did you think of needs outside those shown in this chapter?
- You can differentiate between experience and value. Or is experience part of the value?
- Think of non-price terms that you have paid for a product in addition to price.
You can contact the author at [email protected] for answers or view the website www.CustomerValuefoundation.com


Gaitam, the waterfall is a wonderful way to organize customers needs and attributes. Also, the importance percentage should help the product developers and implementors organize the entity to take great care of the purchaser.
In the future, I recommend that you include a special place for the waterfall developer to clearly articulate the buyers expected outcome of each step. For example, in the “need” stage the expected outcome is an answer to these two questions: ‘What do I want?” and “What will I use it for?”
However, in the “use” stage the expected outcome is very vaguely staged as “Works well”. Surely, a buyer will have a detailed mental definition of “well”. Maybe, “allows us to product X items/hour” or “reduce process time by Y minutes” or “increase customer satisfaction by Z% over the first six months of use.”
Hope this helps.
Sam, good point.
Like the attribute tree, the waterfall items have their own sub-attributes or sub-waterfalls. In my example, I have not gone into the sub-waterfalls. I think these are important and must be developed bu marketing, product developers, service people; indeed by the whole company.