
Data scientists rely on tools/products/solutions to help them get insights from data. Gregory Piatetsky of KDNuggets conducts an annual survey of data data professionals to better understand the different types of tools they use. Here are the results of the 2015 survey. He followed his initial posting with additional analyses to better understand which tools go together. In the latter posting, he looked at pairs of tools and found that some tools tend to go together (usage of tools are correlated with each other). He offered the anonymized raw data set for free to encourage other people to analyze the data, which I did.
Dimension Reduction through Principal Components Analysis
His approach looked at pairs of tools to understand their relationship with the other. I took a slightly different approach. I applied principal components analysis. The current approach groups the tools by looking at the relationship among all tools simultaneously. In general, principal components analysis examines the statistical relationships (e.g., covariances) among a large set of variables and tries to explain these correlations using a smaller number of variables (components).
The results of the principal components analysis are presented in tabular format called the principal component matrix. The factor matrix is an NxM table (N = number of original variables and M = number of underlying components). The elements of a principal component matrix represent the relationship between each of the variables and the components. These elements represent the strength of relationship between the variables and each of the underlying components. The results of the principal components analysis tell us two things:
- number of underlying components that describe the initial set of variables
- which variables are best represented by each component
Results
This use of principal components analysis is exploratory in nature. That is, I didn’t impose a pre-defined structure on the data itself. The pattern of relationships among the 95 tools drove the pattern of results. While human judgment comes into play in the determination of the number of components that best describe the data, the selection of the number of components is based on the results. The goal of the current analysis was to explain the relationship among the 95 tools with as few components as was necessary. Toward that end, there are a couple of rules of thumb that I used to determine the number of components using the eigenvalues (output of principal components analysis). The first rule of thumb is to set the number of components based on the number of eigenvalues greater than unity (1.0). Another way is to plot (called a scree plot) the 95 eigenvalues to identify a clear breaking point along the eigenvalues.
The plot of the eigenvalues appeared to break around the 13th and 14th eigenvalue. Therefore, I chose a 13-factor solution to explain the relationships among the 95 data science tools.
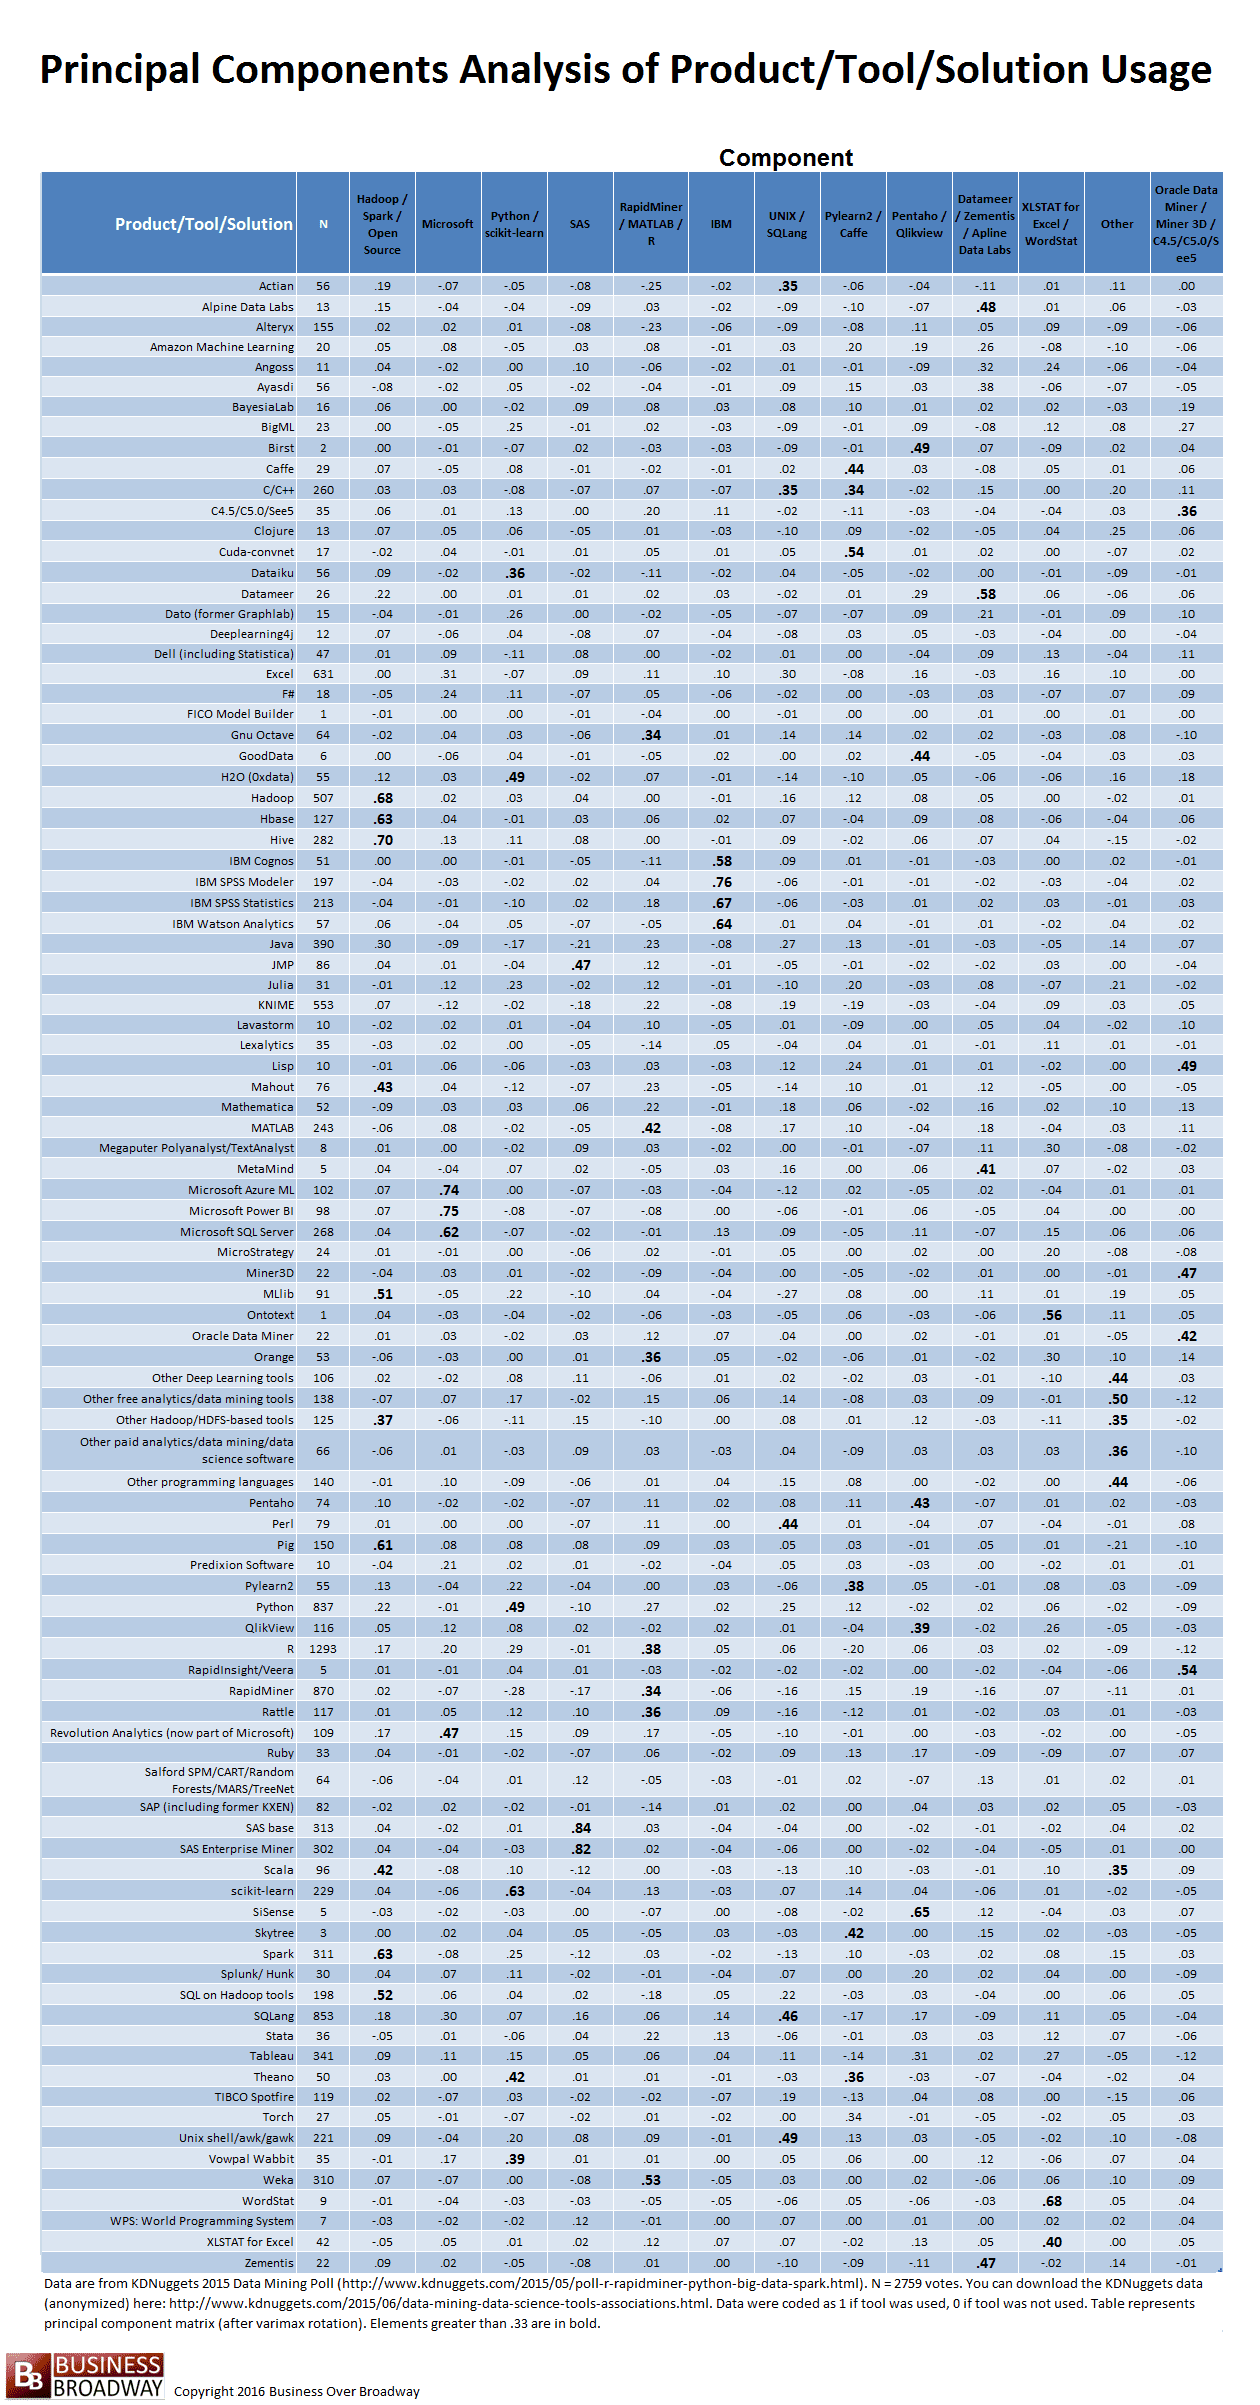
Based on a 13-factor solution, the principal component matrix (see Table 1) was somewhat easy to interpret. Some of the cell values in the matrix in Table 1 are bold to represent values greater than .33. The components’ headings are based on the tools that loaded highest on that component. For example, four IBM products loaded highly on component 6, showing that usage of these tools by a given respondent tend to go together (if you use one of IBM’s tools, you tend to use the other(s)); as a result, I labeled that component as IBM. Similarly, based on the tools that were highly related to the other 12 factors, the other 12 factors were labeled accordingly.
Tool Groupings
The results suggest that 13 tool grouping describe the data. I’ve listed the groupings below and include the tools that describe each grouping (if number of votes are greater than 20). Tools that fall within a specific group tend to be used together.
- Hadoop, HBase, Hive, Mahout, MLlib, Other Hadoop/HDFS-based tools, Pig, Scala, Spark, SQL on Hadoop tools
- Microsoft Azure ML, Microsoft Power BI, Microsoft SQL Server, Revolution Analytics
- Dataiku, H2O (0xdata), Python, scikit-learn, Theano, Vowpal Wabbit
- JMP, SAS Base, SAS Enterprise Miner
- Gnu Octave, MATLAB, Orange, R, RapidMiner, Rattle, Weka
- IBM Cognos, IBM SPSS Modeler, IBM SPSS Statistics, IBM Watson Analytics
- Actian, C/C++, Perl, SQLang, Unix shell/awk/gawk
- Caffe, Pylearn2
- Pentaho and QlikView
- Datameer and Zementis
- XLSTAT for Excel
- Other Deep Learning tools, Other free analytics/data mining tools, Other Hadoop/HDF-based tools, Other paid analytics/data mining/data science software, Other programming languages
- C4.5/C5.0/See5, Miner3D, Oracle Data Miner
Summary
The use of specific Big Data, data mining and data science tools tend to occur together. Based on the current analysis of tool usage, the 90+ tools can be grouped into a smaller subsets of tools. The results of the current analysis are somewhat consistent with the prior results. For example, Piatetsky found that Pig usage was closely associate with Hadoop, Spark, scikit-learn, Unix shell/awk/gawk and Python. In the current analysis, we found that Pig was also associated with Hadoop and Spark. However, we found that the use of Pig was associated with HBase, Hive, Mahout, MLlib, Scala and SQL on Hadoop. It’s important to note that the former analysis used the top 20 tools while the latter analysis used all 90+ tools; this difference could explain the differences between the two analyses.
To improve your chances of success in your Big Data projects, it’s important that you select the right data tools. No single tool will do it all, and data professionals tend to use more than one data-related tool (in this study, we found that, on average, data professionals use 5 data tools). One way to help in your selection process is to identify the tools sets that other data professionals are using. The results suggest that you consider looking at tools within components as potential candidates for tools you might consider.
Some of the tool groupings are simply based on the parent company of the tools, including IBM, Microsoft and SAS. Perhaps cross-selling data science tools is a lot easier within a major brand than it is across different brands. This makes sense to the extent that a company’s products likely work together better than with other vendors’ products. Still, more research is definitely needed to understand why certain tools tend to be used together.
I’m interested in seeing what others find with these data. Here is the link to the anonymized data set (CSV format).


Interesting analysis, Bob, thanks for sharing. Not surprised to see the IBM_only & SAS_mainly combinations. Plus, there are definitely still organisations getting by with Excel. But was surprised by some of the other combinations, like the number of Hadoop & Spark tools used together and people using MatLab & Rapid Miner together.
Obviously some businesses have invested in a combination of tools already. More research & analysis to help them understand best fit with existing investment would help.
Great points shared in the blog. It is indeed interesting to see how businesses are using a combination of tools for their Big Data projects. While there are undoubtedly some amazing dedicated big data tools available in the market, I am surprised at the exceptional performance of some new-age CRM platforms like Zoho, Base CRM and ConvergeHub that also excel at mining these endless chunks of data, analyze them and render great insights to businesses that help them in improving their sales, marketing and customer service processes. It’ll be exciting to see how these new-age CRM platforms evolve further in the oncoming times as a big data management tool.