
As marketers, we want to be better consumers of data. Presented with data and its analysis, we want to be able to judge its accuracy and relevance to our decision making. We want to gauge its ambiguity and uncertainty, even though on the surface we’re being presented with quantified “facts.” We want to detect bias and account for it.
So let’s start with our own statistics in content marketing.
Because, seriously, too many of the stats that are appearing in content marketing these days smell fishy. I don’t want to pick on anyone in particular — there are too many folks doing this to unfairly single out one — so I’ll give you a hypothetical example:
Company X reports that their latest state-of-the-industry survey reveals 72% of marketers are engaging in — or plan to engage in — hamster optimization. Clearly hamster optimization is big! And isn’t that great, because coincidentally Company X just happens to be a hamster optimization provider…
You’ve certainly see examples like that. Some are blatantly biased. Others are a little more subtle. But the content marketing arms race has fueled the fire for many newsworthy-but-questionably-justified kinds of claims like these.
Now, being biased is not necessarily a terrible thing — as long as you disclose your bias and don’t try to sweep it under the rug. Qualify the data on which your statistics are based, so that readers can make a fair assessment of the context and relevance of your findings. After all, you presumedly want your readers to trust you. That’s kind of the bigger brand mission with your content marketing in the first place, right?
5 ways to make your statistics more authentic
There are five things you can — and should — do when presenting survey statistics:
- Note the sample size — how many people participated.
- Break down the basic firmographics of the participants.
- Describe how the participants were selected.
- Include the original question and answer choices.
- Define nomenclature that may be highly subject to interpretation.
The first, noting sample size, most people already do. If you don’t, start now because it’s an immediate red flag if it’s not stated — and because n = 20 is very different than n = 2,000. Conclusions drawn from small samples are weaker than those from large samples. And while there may still be value in sharing results from undersized samples, the value is more anecdotal than statistical. Play fair and let people know that.
How large should your sample size be — how big should n be? It depends on some slightly technical parameters such as confidence level and confidence interval. But here’s a simple sample size calculator you can use with some basic examples to put you in the ballpark.
The second, breaking down the basic firmographics of participants, is unfortunately less common. Firmographics are things such as the size of participants’ companies in revenue or employees, their geographic region, their industry, whether they’re B2B or B2C, etc. You may also consider including the level of the participants — mid-level managers, senior directors, top executives, etc.
You don’t have to go overboard, but even a little bit of this information goes a long way towards qualifying your results. If all your participants were mid-level managers from enterprises with $100 million or more in revenue, that’s probably a very different story than if your data comes from top executives at small businesses with less than 50 employees.
The third, describing how participants were selected, is the difference between the amateurs and the pros. Any professional research will disclose how the participants were found, enticed, and qualified, usually under the heading “methodology.” Here’s an example from a report on business analytics by Harvard Business Review and SAS:
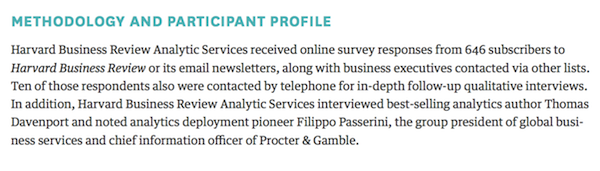
This is super important because selection bias — a set of characteristics or circumstances that influenced the selection of participants — can profoundly skew the results of a study.
For example, let’s go back to our hypothetical hamster optimization provider, Company X. For their survey, they reach out to their blog subscribers, Twitter followers, and Facebook fans to participate. It should come as no surprise that a sample of that population — people who follow Company X — would have pretty positive views on hamster optimization. (“Hamster optimization rules!”)
The results would likely be quite different if Company X invited participants from a random set of Harvard Business Review subscribers. (“What the heck is hamster optimization?”)
To be honest, selection bias is almost impossible to avoid — especially in industry studies with modest budgets, which is usually the case in guerrilla content marketing. That’s okay. Just disclose your selection methodology so that readers can adjust their interpretation with that bias in mind.
For Company X to pull participants mostly from its own universe, but to report as if their findings represent a more general population, however, would be disingenuous.
If you fear that disclosing your selection methodology could undermine the results of your study — that should be a warning bell — then you might consider ponying up money to find a less biased population to sample. This is one of the services that professional industry analyst firms offer. They’re not free from selection bias either, of course, but their audiences are usually much less biased than the ecosystem around a single vendor.
The fourth, including the original question and answer choices, helps make sure that you, your survey participants, and your content consumers are all talking about the same thing.
If you ask a question like, “Do you use data-driven decision making?” and get Y% who respond “yes” — but then in your report you write, “Y% are data-driven decision makers” — you’re changing the meaning. Participants may have answered the question thinking that they occasionally use data-driven decision making along with other experience-driven approaches. But the statement in your report could be interpreted that those participants predominantly or exclusively use data-driven decision making.
This effect can be subtle or significant. But it’s easy to avoid problems by simply restating the question and answers verbatim. You can add other narrative around that, but you’re clear about what’s data and what’s narrative.
Finally, defining nomenclature that may be highly subject to interpretation, in both the survey and the report, avoids misinterpretations. For instance, if you’re surveying how many marketing teams have a “marketing technologist” on staff, you might want to define who qualifies as a marketing technologist. An IT person working in marketing? A web developer? A marketing automation specialist? Depending on the definition, you may get very different results.
Particularly with so many new terms popping up in our profession, including brief definitions in your study can help reduce the risk of wildly different interpretations impacting the accuracy of your analysis.
This certainly isn’t an exhaustive list of survey and statistical analysis dos and don’ts. But if we could raise the bar on survey-driven content marketing to address these five issues, it would make that content more valuable than a quick flurry of soundbite tweets on Twitter — it would provide information that our readers could actually use in more data-driven decision making.
And it would make you a more credible source in the eyes of your audience — as all good content marketing should.


