
In the modern marketing era, the competition to get eyes on your content can be tough, as people often leave websites within 10-20 seconds of landing on them. Furthermore, according to a study by Nielsen Norman Group, most internet users only have the time to read 28% of the words that they see online. These trends have made it increasingly difficult for brands to spark readers’ interests and grow their audience base online.
In order to effectively engage users, marketers have had to get pretty creative with their content production. A wide range of studies have shown how visual content tends to be far more effective at encouraging readership, shares, engagement and purchase, so it has become vital to leverage these types of content to maximize marketing capabilities.
Infographics are a type of visual content that have really made waves over the last decade or so. However, this is nothing new, and content creators have been taking advantage of their success. This means that competition is fierce and it’s no longer good enough to simply create an infographic. To win with your infographic, it can’t just be good, it has to be killer.
So, how do you create a killer infographic? I’ve broken it down into 10 simple steps:
1. Determine Your Audience

(Source: pixabay.com)
Before you start designing your infographic, you should ask yourself these two questions: “Who is my audience?” and “What do they want to know?”
Research your media landscape and find opportunities to connect with your audience. What are they talking about? What are their concerns/interests/pain points? Then use the answers to these questions to develop topics that are timely, relevant and audience-driven. Common channels to find out about your audience include social media, polls/surveys, forums and industry communities.
It’s important to know who your target audience is and what they want so you can determine the purpose of your infographic. Skipping this step might cause you to lose sight of what’s important to them. No one knows your audience better than they do, so listening is the key.
2. Gather the Data
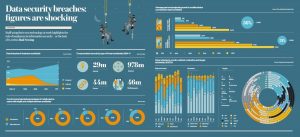
(Source: raconteur.net)
After defining your audience and developing a topic, it’s time to research. This step is critical because data is at the core of virtually any successful infographic. They’re really just visualizations of data, so relevance and accuracy are hugely important.
Find reputable sources and make sure that extracted data is up to date and verifiable. Fact-check your data especially if it’s statistical. You should also make sure that your graphical representation of the data correlates with the figures themselves. There’s nothing worse than seeing the figures alongside a complementary visual that doesn’t complement.
3. Create an Engaging Narrative
(Source: feelgoodcontacts.com)
Bring your data to life by creating an engaging narrative out of it. Tell a story and make sure that there is a logical flow that leads your audience right through the entire infographic.
With your readers’ perspective in mind, think of how they will digest the information. What thoughts do you want to provoke? What emotions do you want to evoke? Use these emotions to engage your readers while presenting your data.
4. Develop a Killer Headline
(Source: fatwallet.com)
Similar to a blog article, or any other content for that matter, your infographic’s headline is extremely important if you want to achieve any sort of decent outreach. It should grab the attention of your audience and inform them exactly what they’re about to see.
Good headlines should be short but meaningful. Try and stick to around 70 characters. Titles are more effective when they can be understood at a glance. Bottom line, if you don’t have a compelling title, no one’s going to click on your links.
5. Build a Wireframe
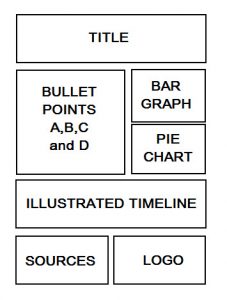
(Source: crazyegg.com)
Wireframes are the body and structure of your infographic. They’re also a designer’s blueprint before they construct the image itself. Wireframing allows designers to explore concepts in presenting data. Mapping out your infographic is a great way to see the “bigger picture”.
Focus on the layout and flow of the infographic, and make sure that all your data will fit. Make the potentially complex data understandable and filter out unnecessary information. Once you’re finished building your wireframe, you should have a really good idea of what the infographic is going to look like, which makes the rest of the job a whole lot easier.
6. Gather Visual Inspiration

(Source: pixabay.com)
Just like researching for content, visual inspiration is also necessary for your infographic. Sites such as Pinterest and Behance are great sources of design inspiration. Have a look at other infographics in the same genre. It’s not stealing if you modify an idea and make it your own.
Create a mood board where you gather all your ideas including colors, fonts, and illustrations to get a feel of what you want your design theme to look like.
7. Keep the Design Simple

(Source: frugalexpedition.com)
The goal of any infographic is to present large amounts of data in an easily digestible way. The point gets a little lost if you present readers with an overwhelming amount of information that they have to sift through.
Content is a lot more readable when it makes good use of white space. Any graphic designer will tell you that white space makes all the difference.
You also want to make sure that the size and length of your infographic is manageable so it doesn’t take an eternity to load or read. Try to keep your image file under 2 MB. A good target for dimensions is about 600 pixels in width and no more than 10,000 pixels in length.
8. Add a Call to Action (CTA) and Cite Your Sources
(Source: adweek.com)
With an infographic full of valuable information, you can lead your audiences to act on your CTA. What do you want them to do next? Buy the product? Sign up on your website?
You should always make sure that your CTA is relevant to your topic, or your conversion rates will suffer. Pay attention to your CTA design and copy as well. You want to make it stand out from the background and compel readers to take the next action with an awesome statement.
Also, don’t forget to give credit where it’s deserved. You should list your references at the end of your infographic. This will not only show that you’ve done your research, but it also might just draw the attention of your sources to your infographic, which is always a good thing.
9. Make It Easy to View and Share

(Source: pixabay.com)
If you want your infographic to be shared, you’ve got to make it easy to do so. Once again, you don’t want the image file to be too big. You also want to make sure that it’s mobile friendly so that people on mobile devices get a chance to view your content too.
Use social media sharing buttons on your post and provide a copy-and-paste embed code for users to easily share your infographic on their own websites and social media accounts.
10. Ready, Set, Promote!

(Source: pixabay.com)
Promotion and distribution are an essential part of your strategy that many people tend to ignore. Adopting the “if I build it, they will come” mentality will only serve to hinder your reach. Great content is useless if you’re not putting it in front of the “right” people at the “right” time.
After publishing it on your site, you should be sharing it on all your major social media networks such as Facebook, Twitter, and Pinterest. Make sure to share your infographic during “peak hours” to gather more impressions.
You can also submit your infographic to directories like Visual.ly and Daily Infographic to increase exposure and potentially get a free backlink. Leverage the audiences of industry influencers by getting them to share your content. It could be as easy as sending them an email and telling them to check it out.
The more shares and republishes you get, the better your chances of going viral.
Conclusion
Creating your own infographic from scratch can take days or even weeks, depending on its length and complexity. It may take a lot of work from the research to design, but the hard work will pay off if you do things right.
Remember to also include a description (300< words) of your infographic on your post. Search engines can’t crawl images so telling Google what it’s about will definitely help with SEO so people can find your infographic organically.
Follow these (relatively) simple steps and you too can create a killer infographic.


